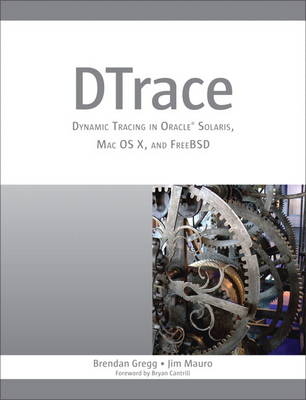
DTrace
Prentice Hall (Verlag)
978-0-13-209151-0 (ISBN)
- Titel ist leider vergriffen;
keine Neuauflage - Artikel merken
Written by key contributors to the DTrace community, DTrace teaches by example, presenting scores of commands and easy-to-adapt, downloadable D scripts. These concise examples generate answers to real and useful questions, and serve as a starting point for building more complex scripts. Using them, you can start making practical use of DTrace immediately, whether you're an administrator, developer, analyst, architect, or support professional.
The authors fully explain the goals, techniques, and output associated with each script or command. Drawing on their extensive experience, they provide strategy suggestions, checklists, and functional diagrams, as well as a chapter of advanced tips and tricks. You'll learn how to
Write effective scripts using DTrace's D language
Use DTrace to thoroughly understand system performance
Expose functional areas of the operating system, including I/O, filesystems, and protocols
Use DTrace in the application and database development process
Identify and fix security problems with DTrace
Analyze the operating system kernel
Integrate DTrace into source code
Extend DTrace with other tools
This book will help you make the most of DTrace to solve problems more quickly and efficiently, and build systems that work faster and more reliably.
Brendan Gregg is a performance specialist at Joyent and is known worldwide in the field of DTrace. Brendan created and developed the DTraceToolkit and is the coauthor of SolarisTM Performance and Tools (Prentice Hall, 2006) as well as numerous articles about DTrace. Many of Brendan's DTrace scripts are shipped by default in Mac OS X. Jim Mauro is a senior software engineer for Oracle Corporation, working in the Systems group with a primary focus on systems performance. Jim has 30 years of experience in the computer industry and coauthored SolarisTM Performance and Tools and the first and second editions of SolarisTM Internals (Sun Microsystems Press, 2000, and Prentice Hall, 2006).
Foreword xxi
Preface xxv
Acknowledgments xxxi
About the Authors xxxv
Part I: Introduction
Chapter 1: Introduction to DTrace 1
What Is DTrace? 1
Why Do You Need It? 1
Capabilities 2
Dynamic and Static Probes 4
DTrace Features 4
A First Look 6
Overview 8
Architecture 16
Summary 17
Chapter 2: D Language 19
D Language Components 20
Probes 23
Variables 26
Aggregations 33
Actions 37
Options 43
Example Programs 44
Summary 49
Part II: Using DTrace
Chapter 3: System View 51
Start at the Beginning 52
Observing CPUs 56
Observing Memory 95
Observing Disk and Network I/O 125
Summary 148
Chapter 4: Disk I/O 151
Capabilities 152
Disk I/O Strategy 154
Checklist 155
Providers 156
Scripts 172
Case Studies 269
Summary 290
Chapter 5: File Systems 291
Capabilities 292
Strategy 295
Checklist 296
Providers 297
Scripts 313
Case Study 387
Summary 397
Chapter 6: Network Lower-Level Protocols 399
Capabilities 400
Strategy 402
Checklist 403
Providers 404
Scripts 445
Common Mistakes 548
Summary 555
Chapter 7: Application-Level Protocols 557
Capabilities 558
Strategy 558
Checklist 559
Providers 560
Scripts 574
Summary 668
Chapter 8: Languages 669
Capabilities 671
Strategy 672
Checklist 674
Providers 675
C 679
C++ 689
Java 691
JavaScript 705
Perl 719
PHP 731
Python 740
Ruby 751
Shell 764
Tcl 774
Summary 782
Chapter 9: Applications 783
Capabilities 784
Strategy 784
Checklist 786
Providers 787
Scripts 804
Case Studies 817
Summary 832
Chapter 10: Databases 833
Capabilities 834
Strategy 835
Providers 836
MySQL 837
PostgreSQL 851
Oracle 858
Summary 865
Part III: Additional User Topics
Chapter 11: Security 867
Privileges, Detection, and Debugging 867
Scripts 875
Summary 892
Chapter 12: Kernel 893
Capabilities 894
Strategy 896
Checklist 897
Providers 897
Scripts 932
Summary 945
Chapter 13: Tools 947
The DTraceToolkit 948
Chime 962
DTrace GUI Plug-in for NetBeans and Sun Studio 966
DLight, Oracle Solaris Studio 12.2 966
Mac OS X Instruments 971
Analytics 973
Summary 985
Chapter 14: Tips and Tricks 987
Tip 1: Known Workloads 987
Tip 2: Write Target Software 989
Tip 3: Use grep to Search for Probes 991
Tip 4: Frequency Count 991
Tip 5: Time Stamp Column, Postsort 992
Tip 6: Use Perl to Postprocess 993
Tip 7: Learn Syscalls 994
Tip 8: timestamp vs. vtimestamp 995
Tip 9: profile:::profile-997 and Profiling 996
Tip 10: Variable Scope and Use 997
Tip 11: strlen() and strcmp() 999
Tip 12: Check Assumptions 1000
Tip 13: Keep It Simple 1001
Tip 14: Consider Performance Impact 1001
Tip 15: drops and dynvardrops 1003
Tip 16: Tail-Call Optimization 1003
Further Reading 1003
Appendix A: DTrace Tunable Variables 1005
Appendix B: D Language Reference 1011
Appendix C: Provider Arguments Reference 1025
Providers 1025
Arguments 1038
Appendix D: DTrace on FreeBSD 1045
Enabling DTrace on FreeBSD 7.1 and 8.0 1045
DTrace for FreeBSD: John Birrell 1047
Appendix E: USDT Example 1051
USDT Bourne Shell Provider 1052
Case Study: Implementing a Bourne Shell Provider 1057
Appendix F: DTrace Error Messages 1063
Privileges 1063
Drops 1064
Aggregation Drops 1065
Dynamic Variable Drops 1066
Invalid Address 1066
Maximum Program Size 1067
Not Enough Space 1068
Appendix G: DTrace Cheat Sheet 1069
Synopsis 1069
Finding Probes 1069
Finding Probe Arguments 1070
Probes 1070
Vars 1070
Actions 1071
Switches 1071
Pragmas 1071
One-Liners 1072
Bibliography 1073
Suggested Reading 1073
Vendor Manuals 1075
Index 1089
| Erscheint lt. Verlag | 21.4.2011 |
|---|---|
| Verlagsort | Upper Saddle River |
| Sprache | englisch |
| Maße | 180 x 233 mm |
| Gewicht | 1415 g |
| Themenwelt | Mathematik / Informatik ► Informatik ► Betriebssysteme / Server |
| Informatik ► Office Programme ► Outlook | |
| Informatik ► Software Entwicklung ► Qualität / Testen | |
| ISBN-10 | 0-13-209151-8 / 0132091518 |
| ISBN-13 | 978-0-13-209151-0 / 9780132091510 |
| Zustand | Neuware |
| Haben Sie eine Frage zum Produkt? |
aus dem Bereich


