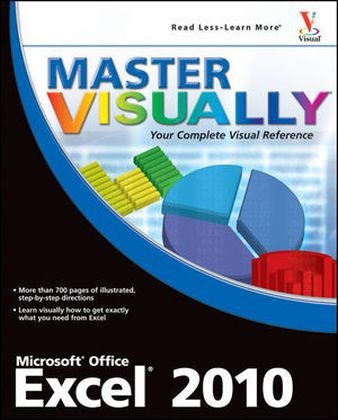
Master Visually Excel 2010
John Wiley & Sons Ltd (Verlag)
978-0-470-57769-1 (ISBN)
- Titel ist leider vergriffen;
keine Neuauflage - Artikel merken
PART I: Excel Basics. 1 Getting Started with Excel What You Can Do in Excel. Start and Close Excel. Understanding the Excel Screen. Learn Excel Terminology. Understanding the Ribbon. Work with the Mini Toolbar and Context Menu. Work with Backstage View. Enter Information. Undo and Redo. Move Around in a Worksheet. 2 Managing Workbooks. Save a Workbook. Reopen an Unsaved Workbook. Open a Workbook. Convert an Excel 97-2003 Workbook to Excel 2010. Start a New Workbook. Switch between Workbooks. Add Properties to a Workbook. Close a Workbook. 3 Formatting Cells. Change Fonts or Font Size. Apply Boldface, Italics, or Underlining. Change the Font Color. Apply Font Effects. Understanding Number Formats. Assign a Format to a Value. Fill Cells with Color. Indent Text within Cells. Align Cell Content Vertically. Align Cell Content Horizontally. Wrap Text within Cells. Shrink Text within Cells. Rotate Text in Cells. Add Borders to Cells. Apply a Style. Create a Style. Copy Formatting. Clear Formatting. PART II: Designing Worksheets. 4 Editing and Proofreading Worksheets Work with Themes. Select Cells. Move or Copy Information. Use Paste Options to Control Formatting. Find and Replace Information. Check Spelling. Edit the Dictionary. Translate Text. Using the Thesaurus. 5 Adjusting Worksheets. Insert and Delete Rows. Insert and Delete Columns. Swap Rows and Columns. Adjust Row Height. Adjust Column Width. Copy Width from One Column to Another. Hide and Unhide Rows or Columns. Merge Cells in Columns or Rows. 6 Managing the Workbook Structure. Set Worksheet Tab Colors. Edit Multiple Worksheets Simultaneously. Add or Delete a Worksheet. Move or Copy a Worksheet. Rename a Worksheet. Hide and Unhide a Worksheet. Hide and Unhide a Workbook. 7 Working with Views. Switch Views. Zoom In and Zoom Out. Create and Use a Custom View. Hide or Display Gridlines. Hide or Display Row Numbers and Column Letters. Hide or Display the Formula Bar. Open a New Window. Freeze Column and Row Titles. Split a Window. 8 Printing Worksheet Information. Set Margins. Add Headers and Footers to a Worksheet. Select an Area to Print. Insert, Adjust, or Remove Page Breaks. Set Page Orientation. Print Row and Column Titles on Each Page. Set Paper Size. Control the Width and Height of Printed Output. Print Gridlines. Print Row Numbers and Column Letters. Preview and Print. PART III: Calculating Data. 9 Performing Basic Math. The Basics of Formulas in Excel. Fill a Range with Information. Add Numbers. Multiply Numbers. Edit a Formula. Quickly Compute Common Calculations. Absolute and Relative Cell References. Copy a Formula. Change a Formula to a Value. Add Data in One Range to Another. Add Data in One Worksheet to Another. Using Cell Names and Range Names. Edit and Delete Cell or Range Names. Create Range Names from Headings. Apply Names to Existing Formulas. Understanding Arrays. Create an Array Formula. Using the SUM Function in an Array Formula. 10 Working with Common Formulas. Sum Numbers. Calculate a Running Balance. Calculate a Percentage. Calculate an Average. Determine a Maximum Value. Identify a Minimum Value. Calculate a Conditional Sum. Round Values. Count the Number of Cells Containing Information. Create a Frequency Distribution. Find the Most Frequently Occurring Value in a Range. Calculate a Subtotal. 11 Mastering Date and Time Formulas. Calculate Elapsed Days between Dates. Insert Today's Date in a Cell. Work with Times. View the Serial Number for a Date or Time. Calculate a Serial Date Number. Convert a Text Date to a Date Value. Calculate Part of a Date. Determine the Week of the Year. Calculate a Due Date. Convert a Text Time to a Time Value. Convert a Time Value into Hours, Minutes, or Seconds. 12 Working with Financial Formulas. Calculate the Present Value of an Investment. Calculate the Net Present Value of an Investment. Calculate the Future Value of an Investment. Calculate a Loan Payment. Depreciate Assets. 13 Working with Commonly Used Lookup Formulas. Look Up a Single Value in a Column. Look Up a Single Value in a Row. Look Up a Value in a Table. Choose a Value from a List. 14 Applying Reference, Information, and Text Formulas. Determine the Number of Columns in a Selection. Determine the Number of Rows in a Selection. Change Text Case. Join Text. Split Text. Change Text to Values. Combine Text and Values. Remove Spaces from Imported Data. 15 Working with Logical and Error Trapping Formulas. Understanding Error Values. Make a Decision. Test for True or False. Avoid Displaying Errors. 16 Analyzing Tabular Information with Functions. Understanding Database Functions. Sum Records That Meet a Single Criterion. Sum Records That Meet Multiple Criteria. Count Records That Meet a Single Criterion. Count Records That Meet Multiple Criteria. Average Records That Meet a Single Criterion. Average Records That Meet Multiple Criteria. Find the Smallest Record That Meets Criteria. Find the Largest Record That Meets Criteria. 17 Analyzing Formulas and Functions. Understanding Excel Errors. Display and Print Formulas in Cells. Identify Cells Containing Formulas. Evaluate Formulas. Check for Formula Errors. Trace Cell Relationships. Control Data Entry. PART IV: Mastering Excel Charts. 18 Discovering Chart Basics. Create a Sparkline Chart. Modify a Sparkline Chart. Understanding Charts. Understanding the Chart Window. Create a Column Chart. Create a Pie Chart. Change the Chart Type. Select a Chart Layout. Change the Chart Style. Move a Chart to a Separate Sheet. Reposition an Embedded Chart. Resize an Embedded Chart. Change the Data Included in the Chart. Switch Rows and Columns on the Chart. Create a Combination Chart. 19 Changing Chart Layout Details. Add a Chart Title. Format the Chart Title. Display the Horizontal Axis Title. Format the Horizontal Axis Title. Display the Vertical Axis Title. Format the Vertical Axis Title. Reposition or Hide the Chart Legend. Show Data Labels. Show the Data Table. Format the Plot Area. Format the Chart Walls of a 3-D Chart. Format the Chart Floor of a 3-D Chart. Change the Rotation of a 3-D Chart. Set Axis Options. Change Horizontal and Vertical Gridlines. Add a Trendline. Add Line Markers on a Chart. Set Chart Element Shape Styles. Set Fill Colors for Chart Element Shapes. Set the Shape Outline for a Chart Element. Set Shape Effects for Chart Elements. PART V: Analyzing Data. 20 Working with Graphic Elements. Understanding Graphic Elements. Capture a Screenshot. Include a Shape in a Worksheet. Add WordArt to a Worksheet. Insert a Text Box. Insert a Symbol. Move or Resize a Graphic Element. Change the Shape of a Graphic Element. Modify a Graphic Element Border. Add an Artistic Effect to a Graphic Element. Crop a Graphic Element. Position Graphic Elements. Align Graphic Elements. Rotate Graphic Elements. 21 Working with Tables. Create a Table. Change the Size of a Table. Use a Data Entry Form. Create a Drop-Down List for Data Entry. Filter or Sort Table Information. Change the Table Style. Apply Special Formatting. Display or Hide Banding. Hide or Display the Header Row. Work with the Total Row. Filter to Hide Duplicates. Remove Duplicates from a Table. Convert a Table to a Range. 22 Summarizing Data with PivotTables and PivotCharts. Understanding PivotTables. Create a PivotTable by Using Numeric Data. Pivot Elements in a PivotTable. Change PivotTable Display Options. Create a PivotTable with Nonnumeric Data. Filter a PivotTable. Sort Information in a PivotTable. Group Items in a PivotTable. Insert a PivotTable Slicer. Apply a Style to the PivotTable. Add or Remove Blank Rows. Adjust the PivotTable Layout. Hide or Display Subtotals. Hide or Display Row and Column Grand Totals. Change Values in a PivotTable. Change Data in the PivotTable. Add a Calculated Item to a PivotTable. Cell References and PivotTables. Working with a PivotChart. 23 Visually Analyzing Data. Highlight Cells That Are Greater Than a Specified Value. Identify the Top Ten Items in a List. Highlight the Bottom 5% of a List. Identify Above-Average List Items. Highlight Values Falling between Two Numbers. Highlight Duplicate Values. Highlight Cells Containing Specific Text. Highlight Cells Containing a Date. Add Data Bars to Represent Data Values. Apply Color Scales to Data. Use Icon Sets to Highlight Values in a List. Clear Conditional Formats. Manage Conditional Formatting Rules. Create a New Conditional Formatting Rule. 24 Linking and Consolidating Worksheets. Link Worksheets by Pointing. Paste Links. Update Links. Switch the Link Source. Disable Links. Consolidate Data by Position. Consolidate Data by Using Labels. 25 Performing What-If Analysis. Create Various Scenarios. Display a Scenario. Switch Scenarios Quickly. Merge Scenarios. Create a Scenario Report. Create a Scenario PivotTable. Create a Data Table to Summarize Loan Possibilities. Create a Data Table to Model Sales Projections. Seek a Goal. 26 Performing Advanced Statistical Analyses. Calculate Anova. Measure Correlation. Measure Covariance. Produce Descriptive Statistics. Exponentially Smooth Data. Perform a Two-Sample F-Test. Calculate a Moving Average. Generate a Random Number. Create a Rank and Percentile Table. Perform a Regression Analysis. Generate a Sample. Analyze the Statistical Significance of Small Samples. PART VI: Customizing the Excel Environment. 27 Working with Macros. Macro Basics. Macros and Security. Record a Macro. Run a Macro. Add a Keyboard Shortcut to a Macro. Save a Workbook Containing a Macro. Add a Macro to the Quick Access Toolbar. Handle Workbooks That Contain Macros. 28 Customizing the Excel Environment. Manage the Status Bar. Change the Location of the Quick Access Toolbar. Add a Button to the Quick Access Toolbar. Minimize the Ribbon. Add a Predefined Group to a Ribbon Tab. Create Your Own Ribbon Group. Create Your Own Ribbon Tab. Understanding General Options. Change General Options. Understanding Common Calculation Options. Change Common Calculation Options. Understanding Advanced Calculation Options. Set Advanced Calculation Options. Understanding Error-Checking Options. Work with Error-Checking Options. Work with AutoCorrect Options. Control Automatic Formatting. Change Proofing Options. Understanding Save Options. Select Options for Saving Files. Understanding Editing Options. Set Editing Options. Understanding Program Display Options. Set Program Display Options. Understanding Display Options for the Workbook/Worksheet. Set Display Options for the Workbook and Worksheet. Understanding Advanced General Options. Set Advanced General Options. Set Web Options. Enable Excel Add-Ins. Control Security with the Trust Center. PART VII: Using Excel in Collaboration with Others. 29 Using Workbooks in a Multiuser Environment. Inspect a Workbook Before Sharing. Assign a Password to a Workbook. Encrypt a Workbook. Protect Workbooks. Protect a Worksheet. Worksheet Actions You Can Protect. Add a Signature Line. Add an Invisible Digital Signature. Add Comments to Cells. Print Comments. Mark a Workbook as Final. Excel and Workbook Sharing. Turn on Change Tracking. How Change Tracking Works. Use the History Sheet to Review Tracked Changes. Combine Reviewers' Comments. Collaborate through E-mail. 30 Sharing Excel Data with Other Programs. Create a Hyperlink in a Workbook. Workbooks and the Internet. Save a Workbook as a Web Page. Import Information from the Web. Import a Text File into Excel. Copy Excel Data into Word. Embed an Excel Workbook into Word. Create an Excel Worksheet in Word. Use Excel Data to Create Mailing Labels in Word. Copy Excel Information into PowerPoint. Import Excel Information into Access. Connect Excel to Access Information. Query Data in an External Source.
| Reihe/Serie | Master VISUALLY |
|---|---|
| Zusatzinfo | ill |
| Verlagsort | Chichester |
| Sprache | englisch |
| Maße | 185 x 229 mm |
| Gewicht | 1466 g |
| Einbandart | Paperback |
| Themenwelt | Informatik ► Office Programme ► Excel |
| ISBN-10 | 0-470-57769-X / 047057769X |
| ISBN-13 | 978-0-470-57769-1 / 9780470577691 |
| Zustand | Neuware |
| Informationen gemäß Produktsicherheitsverordnung (GPSR) | |
| Haben Sie eine Frage zum Produkt? |
aus dem Bereich


