Statistics for Business and Economics & MathXL Student Access Card Package
Pearson Education (US)
978-0-13-247110-7 (ISBN)
- Titel erscheint in neuer Auflage
- Artikel merken
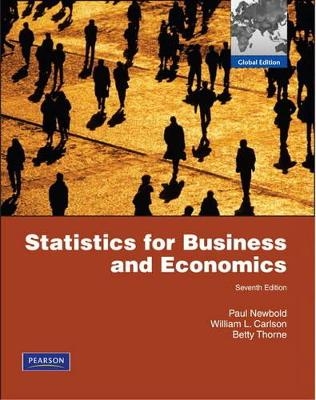
Statistics for Business and Economics enables students to conduct serious analysis of applied problems rather than running simple “canned” applications. This text is also at a mathematically higher level than most business statistics texts and provides students with the knowledge they need to become stronger analysts for future managerial positions.
The seventh edition of this book has been revised and updated to provide students with improved problem contexts for learning how statistical methods can improve their analysis and understanding of business and economics.
CHAPTER 1 Describing Data: Graphical
1.1 Decision Making in an Uncertain Environment
1.2 Classification of Variables
1.3 Graphs to Describe Categorical Variables
1.4 Graphs to Describe Time-Series Data
1.5 Graphs to Describe Numerical Variables
1.6 Tables and Graphs to Describe Relationships Between Variables
1.7 Data Presentation Errors
CHAPTER 2 Describing Data: Numerical
2.1 Measures of Central Tendency
2.2 Measures of Variability
2.3 Weighted Mean and Measures of Grouped Data
2.4 Measures of Relationships Between Variables
CHAPTER 3 Probability
3.1 Random Experiment, Outcomes, Events
3.2 Probability and Its Postulates
3.3 Probability Rules
3.4 Bivariate Probabilities
3.5 Bayes’ Theorem
CHAPTER 4 Discrete Random Variables and Probability
Distributions
4.1 Random Variables
4.2 Probability Distributions for Discrete Random Variables
4.3 Properties of Discrete Random Variables
4.4 Binomial Distribution
4.5 Hypergeometric Distribution
4.6 The Poisson Probability Distribution
4.7 Jointly Distributed Discrete Random Variables
CHAPTER 5 Continuous Random Variables and Probability
Distributions
5.1 Continuous Random Variables
5.2 Expectations for Continuous Random Variables
5.3 The Normal Distribution
5.4 Normal Distribution Approximation for Binomial Distribution
5.5 The Exponential Distribution
5.6 Jointly Distributed Continuous Random Variables
CHAPTER 6 Sampling and Sampling Distributions
6.1 Sampling from a Population
6.2 Sampling Distributions of Sample Means
6.3 Sampling Distributions of Sample Proportions
6.4 Sampling Distributions of Sample Variances
CHAPTER 7 Estimation: Single Population
7.1 Properties of Point Estimators
7.2 Confidence Interval Estimation of the Mean of a Normal Distribution: Population Variance Known
7.3 Confidence Interval Estimation of the Mean of a Normal Distribution: Population Variance Unknown
7.4 Confidence Interval Estimation of Population Proportion
7.5 Confidence Interval Estimation of the Variance of a Normal Distribution
7.6 Confidence Interval Estimation: Finite Populations
CHAPTER 8 Estimation: Additional Topics
8.1 Confidence Interval Estimation of the Difference Between Two Normal
Population Means: Dependent Samples
8.2 Confidence Interval Estimation of the Difference Between Two Normal
Population Means: Independent Samples
8.3 Confidence Interval Estimation of the Difference Between Two Population
Proportions
8.4 Sample Size Determination: Large Populations
8.5 Sample Size Determination: Finite Populations
CHAPTER 9 Hypothesis Testing: Single Population
9.1 Concepts of Hypothesis Testing
9.2 Tests of the Mean of a Normal Distribution: Population Variance
Known
9.3 Tests of the Mean of a Normal Distribution: Population Variance Unknown
9.4 Tests of the Population Proportion
9.5 Assessing the Power of a Test
9.6 Tests of the Variance of a Normal Distribution
CHAPTER 10 Hypothesis Testing: Additional Topics
10.1 Tests of the Difference Between Two Population Means: Dependent Samples
10.2 Tests of the Difference Between Two Normal Population Means: Independent Samples
10.3 Tests of the Difference Between Two Population Proportions
10.4 Tests of the Equality of the Variances Between Two Normally Distributed Populations
10.5 Some Comments on Hypothesis Testing
CHAPTER 11 Simple Regression
11.1 Overview of Linear Models
11.2 Linear Regression Model
11.3 Least Squares Coefficient Estimators
11.4 The Explanatory Power of a Linear Regression Equation
11.5 Statistical Inference: Hypothesis Tests and Confidence Intervals
11.6 Prediction
11.7 Correlation Analysis
11.8 Beta Measure of Financial Risk
11.9 Graphical Analysis
CHAPTER 12 Multiple Regression
12.1 The Multiple Regression Model
12.2 Estimation of Coefficients
12.3 Explanatory Power of a Multiple Regression Equation
12.4 Confidence Intervals and Hypothesis Tests for Individual Regression Coefficients
12.5 Tests on Regression Coefficients
12.6 Prediction
12.7 Transformations for Nonlinear Regression Models
12.8 Dummy Variables for Regression Models
12.9 Multiple Regression Analysis Application Procedure
CHAPTER 13 Additional Topics in Regression Analysis
13.1 Model-Building Methodology
13.2 Dummy Variables and Experimental Design
13.3 Lagged Values of the Dependent Variables as Regressors
13.4 Specification Bias
13.5 Multicollinearity
13.6 Heteroscedasticity
13.7 Autocorrelated Errors
CHAPTER 14 ANALYSIS OF CATEGORICAL DATA
14.1 Goodness-of-Fit Tests: Specified Probabilities
14.2 Goodness-of-Fit Tests: Population Parameters Unknown
14.3 Contingency Tables
14.4 Sign Test and Confidence Interval
14.5 Wilcoxon Signed Rank Test
14.6 Mann—Whitney U Test
14.7 Wilcoxon Rank Sum Test
14.7 Spearman Rank Correlation
CHAPTER 15 Analysis of Variance
15.1 Comparison of Several Population Means
15.2 One-Way Analysis of Variance
15.3 The Kruskal—Wallis Test
15.4 Two-Way Analysis of Variance: One Observation per Cell, Randomized Blocks
15.5 Two-Way Analysis of Variance: More Than One Observation per Cell
CHAPTER 16 Time-Series Analysis and Forecasting
16.1 Index Numbers
16.2 A Nonparametric Test for Randomness
16.3 Components of a Time Series
16.4 Moving Averages
16.5 Exponential Smoothing
16.6 Autoregressive Models
16.7 Autoregressive Integrated Moving Average Models
CHAPTER 17 Sampling: Additional Topics
17.1 Stratified Sampling
17.2 Other Sampling Methods
CHAPTER 18 Statistical Decision Theory
18.1 Decision Making Under Uncertainty
18.2 Solutions Not Involving Specification of Probabilities
18.3 Expected Monetary Value; TreePlan
18.4 Sample Information: Bayesian Analysis and Value
18.5 Allowing for Risk: Utility Analysis
APPENDIX TABLES
1. Cumulative Distribution Function of the Standard Normal
Distribution
2. Probability Function of the Binomial Distribution
3. Cumulative Binomial Probabilities
4. Values of e —λ
5. Individual Poisson Probabilities
6. Cumulative Poisson Probabilities
7. Cutoff Points of the Chi-Square Distribution Function
8. Cutoff Points for the Student’s t Distribution
9. Cutoff Points for the F Distribution
10. Cutoff Points for the Distribution of the Wilcoxon Test Statistic
11. Cutoff Points for the Distribution of Spearman Rank Correlation
Coefficient
12. Cutoff Points for the Distribution of the Durbin—Watson Test Statistic
13 Critical Values of the Studentized Range Q
(page 964 965 Applied Statistical Methods Carlson, Thorne Prentice Hall 1997)
14. Cumulative Distribution Function of the Runs
Test Statistic
ANSWERS TO SELECTED EVEN-NUMBERED EXERCISES
INDEX I-1
| Erscheint lt. Verlag | 24.11.2009 |
|---|---|
| Verlagsort | Upper Saddle River |
| Sprache | englisch |
| Maße | 256 x 202 mm |
| Gewicht | 1574 g |
| Themenwelt | Mathematik / Informatik ► Mathematik ► Finanz- / Wirtschaftsmathematik |
| ISBN-10 | 0-13-247110-8 / 0132471108 |
| ISBN-13 | 978-0-13-247110-7 / 9780132471107 |
| Zustand | Neuware |
| Informationen gemäß Produktsicherheitsverordnung (GPSR) | |
| Haben Sie eine Frage zum Produkt? |
aus dem Bereich


