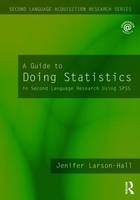
A Guide to Doing Statistics in Second Language Research Using SPSS
Routledge (Verlag)
978-0-8058-6186-0 (ISBN)
- Titel erscheint in neuer Auflage
- Artikel merken
This valuable book shows second language researchers how to use the statistical program SPSS to conduct statistical tests frequently done in SLA research. Using data sets from real SLA studies, A Guide to Doing Statistics in Second Language Research Using SPSS shows newcomers to both statistics and SPSS how to generate descriptive statistics, how to choose a statistical test, and how to conduct and interpret a variety of basic statistical tests. It covers the statistical tests that are most commonly used in second language research, including chi-square, t-tests, correlation, multiple regression, ANOVA and non-parametric analogs to these tests. The text is abundantly illustrated with graphs and tables depicting actual data sets, and exercises throughout the book help readers understand concepts (such as the difference between independent and dependent variables) and work out statistical analyses. Answers to all exercises are provided on the book’s companion website, along with sample data sets and other supplementary material.
Jenifer Larson-Hall is Assistant Professor in the Department of Linguistics and Technical Communication at the University of North Texas.
Part I: Statistical Ideas Chapter 1: Getting started with SPSS and using the computer for experimental details 1.1 Getting started with SPSS 1.2 Manipulating variables 1.3 Random Number Generation 1.4 Summary Chapter 2: Some Preliminaries to Understanding Statistics 2.1 Variables 2.2 Understanding hidden assumptions about how statistical testing works 2.3 Parametric and nonparametric statistics Chapter 3: Describing data numerically and graphically & assessing assumptions for parametric tests 3.1 Numerical Summaries of Data 3.2 Using SPSS to get numerical summaries 3.3 Satisfying assumptions for parametric tests 3.4 Graphic summaries of data: examining the shape of distributions for normality 3.5 Examining the shape of distributions: The assumption of homogeneity 3.6 Dealing with departures from expectations 3.7 Summary Chapter 4: Changing the way we do statistics: Hypothesis testing, power, effect size, and other misunderstood issues 4.1 Null hypothesis significance tests 4.2 Power Analysis 4.3 Effect Size 4.4 Confidence Intervals 4.5 Summary Part II: Statistical Tests Chapter 5: Choosing a statistical test 5.1 Statistical tests that are covered in this book 5.2 A brief overview of correlation 5.3 A brief overview of partial correlation 5.4 A brief overview of multiple regression 5.5 A brief overview of the chi-square test of independence 5.6 A brief overview of t-tests 5.7 A brief overview of one-way ANOVA 5.8 A brief overview of factorial ANOVA 5.9 A brief overview of ANCOVA 5.10 A brief overview of repeated measures ANOVA 5.11 Summary 5.12 Application activity for choosing a statistical test Chapter 6: Finding relationships using correlation: Age of learning 6.1 Visual Inspection: Scatterplots 6.2 Creating Scatterplots 6.3 Assumptions of parametric statistics for correlation 6.4 Calculating correlation coefficients 6.5 Other types of correlations (Advanced topic) 6.6 Summary Chapter 7: Looking for groups of explanatory variables through multiple regression: Predicting important factors in first-grade reading 7.1 Understanding regression design 7.2 Visualizing multiple relationships 7.3 Assumptions of Multiple Regression 7.4 Performing a multiple regression 7.5 Taking regression further: Finding the best fit (Advanced topics) 7.6 Summary Chapter 8: Finding group differences with chi-square when all your variables are categorical: The effects of interaction feedback on question formation and the choice of copular verb in Spanish 8.1 Two types of chi-square tests 8.2 Data Inspection: Tables and Crosstabs 8.3 Visualizing categorical data 8.4 Assumptions of chi-square 8.5 Chi-square statistical test 8.6 Summary of chi-square Chapter 9: Looking for differences between two means with t-tests: Think-Aloud Methodology and Phonological Memory 9.1 Types of t-tests 9.2 Data summaries and numerical inspection 9.3 Assumptions of t-tests 9.4 The independent samples t-test 9.5 The paired-samples t-test 9.6 Reporting t-test results 9.7 Performing a one-sample t-test (Advanced topics) 9.8 Summary of t-tests Chapter 10: Looking for group differences with a one-wayAnalysis of Variance (ANOVA): Effects of planning time 10.1 Understanding ANOVA design 10.2 The topic of Chapter 10 10.3 Assumptions of ANOVA 10.4 One-way ANOVA 10.5 Performing omnibus one-way ANOVA tests in SPSS 10.6 Summary of one-way ANOVAs Chapter 11: Looking for group differences with factorial Analysis of Variance (ANOVA) when there is more than one independent variable: Learning with music 11.1 ANOVA design 11.2 Numerical and Visual Inspection 11.3 Assumptions of factorial ANOVA 11.4 Factorial ANOVAs: extending analyses to more than one independent variable 11.5 Summary Chapter 12: Looking for group differences when the same people are tested more than once using Repeated Measures ANOVA: Wug tests and instruction on French gender 12.1 Understanding repeated measures ANOVA designs variables to decide between RM ANOVA and Factorial ANOVA designs 12.2 Visualizing repeated measures 12.3 Repeated-measures ANOVA assumptions 12.4 Performing an RM ANOVA using SPSS 12.5 Summary Chapter 13: Factoring out differences with analysis of covariance: The effect of feedback on French gender 13.1 Visually and numerically examining the data 13.2 ANCOVA design 13.3 Assumptions of ANCOVA 13.4 Performing an ANCOVA 13.5 Summary Chapter 14: Statistics when your data do not satisfy parametric assumptions: Non-parametric statistics 14.1 Why use non-parametric statistics? 14.2 Non-parametric statistics in SPSS 14.3 Summary
| Reihe/Serie | Second Language Acquisition Research Series |
|---|---|
| Verlagsort | New York |
| Sprache | englisch |
| Maße | 178 x 254 mm |
| Gewicht | 784 g |
| Themenwelt | Geisteswissenschaften ► Sprach- / Literaturwissenschaft ► Sprachwissenschaft |
| Mathematik / Informatik ► Mathematik ► Computerprogramme / Computeralgebra | |
| ISBN-10 | 0-8058-6186-6 / 0805861866 |
| ISBN-13 | 978-0-8058-6186-0 / 9780805861860 |
| Zustand | Neuware |
| Informationen gemäß Produktsicherheitsverordnung (GPSR) | |
| Haben Sie eine Frage zum Produkt? |
aus dem Bereich


