Excel 2016 for Social Science Statistics
Springer International Publishing (Verlag)
978-3-319-39710-8 (ISBN)
- Titel erscheint in neuer Auflage
- Artikel merken
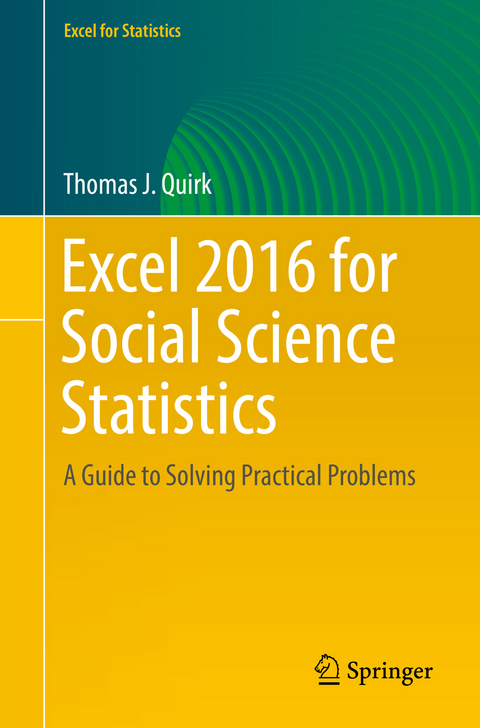
Excel, a widely available computer program for students and managers, is also an effective teaching and learning tool for quantitative analyses in social science courses. Its powerful computational ability and graphical functions make learning statistics much easier than in years past. However, Excel 2016 for Social Science Statistics: A Guide to Solving Practical Problems is the first book to capitalize on these improvements by teaching students and managers how to apply Excel to statistical techniques necessary in their courses and work.
Each chapter explains statistical formulas and directs the reader to use Excel commands to solve specific, easy-to-understand social science problems. Practice problems are provided at the end of each chapter with their solutions in an appendix. Separately, there is a full Practice Test (with answers in an Appendix) that allows readers to test what they have learned.
- Includes 167 illustrations in color
- Suitable for upper undergraduates or graduate students
At the beginning of his academic career, Prof. Tom J. Quirk spent six years in educational research at The American Institutes for Research and Educational Testing Service. He then taught Social Psychology, Educational Psychology, General Psychology, Marketing, Management, and Accounting at Principia College, and is currently a Professor of Marketing in the George Herbert Walker School of Business & Technology at Webster University based in St. Louis, Missouri (USA) where he teaches Marketing Statistics, Marketing Research, and Pricing Strategies. He has written 60+ textbook supplements in Marketing and Management, published 20+ articles in professional journals, and presented 20+ papers at professional meetings. He holds a B.S. in Mathematics from John Carroll University, both an M.A. in Education and a Ph.D. in Educational Psychology from Stanford University, and an M.B.A. from The University of Missouri-St. Louis.
At the beginning of his academic career, Prof. Tom J. Quirk spent six years in educational research at The American Institutes for Research and Educational Testing Service. He then taught Social Psychology, Educational Psychology, General Psychology, Marketing, Management, and Accounting at Principia College, and is currently a Professor of Marketing in the George Herbert Walker School of Business & Technology at Webster University based in St. Louis, Missouri (USA) where he teaches Marketing Statistics, Marketing Research, and Pricing Strategies. He has written 60+ textbook supplements in Marketing and Management, published 20+ articles in professional journals, and presented 20+ papers at professional meetings. He holds a B.S. in Mathematics from John Carroll University, both an M.A. in Education and a Ph.D. in Educational Psychology from Stanford University, and an M.B.A. from The University of Missouri-St. Louis.
lt;p>Introduction.- Sample size, mean, standard deviation, standard error of the mean.- Random number generator.- Confidence interval about the mean using the TINV function and hypothesis testing.- One-group t-test for the mean.- Two-group t-test of the difference of the means for independent groups.- Correlation and simple linear regression.- Multiple correlation and multiple regression.- One-way analysis of variance (ANOVA) .- Appendix A.- Appendix B.- Appendix C.- Appendix D.- Appendix E.- Index.
| Erscheinungsdatum | 08.10.2016 |
|---|---|
| Reihe/Serie | Excel for Statistics |
| Zusatzinfo | XV, 260 p. 167 illus., 165 illus. in color. |
| Verlagsort | Cham |
| Sprache | englisch |
| Maße | 155 x 235 mm |
| Themenwelt | Geisteswissenschaften ► Psychologie |
| Sozialwissenschaften ► Soziologie ► Empirische Sozialforschung | |
| Schlagworte | Applied Sciences • Applied Social Science Statistics • Basic Social Science Statistics • Excel 2016 • Excel 2016 Social Science Statistics • Excel 2016 Textbook • mathematics and statistics • Methodology of the Social Sciences • Practical Social Science Statistics • Psychological Methods/Evaluation • social science statistics • Social Science Statistics with Excel 2016 • statistical modeling • Statistics for Social Science, Behavorial Science, |
| ISBN-10 | 3-319-39710-9 / 3319397109 |
| ISBN-13 | 978-3-319-39710-8 / 9783319397108 |
| Zustand | Neuware |
| Haben Sie eine Frage zum Produkt? |
aus dem Bereich
