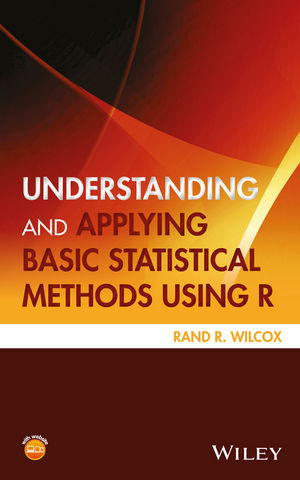
Understanding and Applying Basic Statistical Methods Using R
John Wiley & Sons Inc (Verlag)
978-1-119-06139-7 (ISBN)
Features a straightforward and concise resource for introductory statistical concepts, methods, and techniques using R
Understanding and Applying Basic Statistical Methods Using R uniquely bridges the gap between advances in the statistical literature and methods routinely used by non-statisticians. Providing a conceptual basis for understanding the relative merits and applications of these methods, the book features modern insights and advances relevant to basic techniques in terms of dealing with non-normality, outliers, heteroscedasticity (unequal variances), and curvature.
Featuring a guide to R, the book uses R programming to explore introductory statistical concepts and standard methods for dealing with known problems associated with classic techniques. Thoroughly class-room tested, the book includes sections that focus on either R programming or computational details to help the reader become acquainted with basic concepts and principles essential in terms of understanding and applying the many methods currently available. Covering relevant material from a wide range of disciplines, Understanding and Applying Basic Statistical Methods Using R also includes:
Numerous illustrations and exercises that use data to demonstrate the practical importance of multiple perspectives
Discussions on common mistakes such as eliminating outliers and applying standard methods based on means using the remaining data
Detailed coverage on R programming with descriptions on how to apply both classic and more modern methods using R
A companion website with the data and solutions to all of the exercises
Understanding and Applying Basic Statistical Methods Using R is an ideal textbook for an undergraduate and graduate-level statistics courses in the science and/or social science departments. The book can also serve as a reference for professional statisticians and other practitioners looking to better understand modern statistical methods as well as R programming.
Rand R. Wilcox, PhD, is Professor in the Department of Psychology at the University of Southern California, Fellow of the Association for Psychological Science, and an associate editor for four statistics journals. He is also a member of the International Statistical Institute. The author of more than 320 articles published in a variety of statistical journals, he is also the author eleven other books on statistics. Dr. Wilcox is creator of WRS (Wilcox’ Robust Statistics), which is an R package for performing robust statistical methods. His main research interest includes statistical methods, particularly robust methods for comparing groups and studying associations.
Rand R. Wilcox, PhD, is Professor in the Department of Psychology at the University of Southern California, Fellow of the Association for Psychological Science, and an associate editor for four statistics journals. He is also a member of the International Statistical Institute. The author of more than 320 articles published in a variety of statistical journals, he is also the author eleven other books on statistics. Dr. Wilcox is creator of WRS (Wilcox’ Robust Statistics), which is an R package for performing robust statistical methods. His main research interest includes statistical methods, particularly robust methods for comparing groups and studying associations.
List of Symbols xv
Preface xvii
About the Companion Website xix
1 Introduction 1
1.1 Samples Versus Populations 3
1.2 Comments on Software 4
1.3 R Basics 5
1.3.1 Entering Data 6
1.3.2 Arithmetic Operations 10
1.3.3 Storage Types and Modes 12
1.3.4 Identifying and Analyzing Special Cases 17
1.4 R Packages 20
1.5 Access to Data Used in this Book 22
1.6 Accessing More Detailed Answers to the Exercises 23
1.7 Exercises 23
2 Numerical Summaries of Data 25
2.1 Summation Notation 26
2.2 Measures of Location 29
2.2.1 The Sample Mean 29
2.2.2 The Median 30
2.2.3 Sample Mean versus Sample Median 33
2.2.4 Trimmed Mean 34
2.2.5 R function mean, tmean, and median 35
2.3 Quartiles 36
2.3.1 R function idealf and summary 37
2.4 Measures of Variation 37
2.4.1 The Range 38
2.4.2 R function Range 38
2.4.3 Deviation Scores, Variance, and Standard Deviation 38
2.4.4 R Functions var and sd 40
2.4.5 The Interquartile Range 41
2.4.6 MAD and the Winsorized Variance 41
2.4.7 R Functions winvar, winsd, idealfIQR, and mad 44
2.5 Detecting Outliers 44
2.5.1 A Classic Outlier Detection Method 45
2.5.2 The Boxplot Rule 46
2.5.3 The MAD–Median Rule 47
2.5.4 R Functions outms, outbox, and out 47
2.6 Skipped Measures of Location 48
2.6.1 R Function MOM 49
2.7 Summary 49
2.8 Exercises 50
3 Plots Plus More Basics on Summarizing Data 53
3.1 Plotting Relative Frequencies 53
3.1.1 R Functions table, plot, splot, barplot, and cumsum 54
3.1.2 Computing the Mean and Variance Based on the Relative Frequencies 56
3.1.3 Some Features of the Mean and Variance 57
3.2 Histograms and Kernel Density Estimators 57
3.2.1 R Function hist 58
3.2.2 What Do Histograms Tell Us? 59
3.2.3 Populations, Samples, and Potential Concerns about Histograms 61
3.2.4 Kernel Density Estimators 64
3.2.5 R Functions Density and Akerd 64
3.3 Boxplots and Stem-and-Leaf Displays 65
3.3.1 R Function stem 67
3.3.2 Boxplot 67
3.3.3 R Function boxplot 68
3.4 Summary 68
3.5 Exercises 69
4 Probability and Related Concepts 71
4.1 The Meaning of Probability 71
4.2 Probability Functions 72
4.3 Expected Values, Population Mean and Variance 74
4.3.1 Population Variance 76
4.4 Conditional Probability and Independence 77
4.4.1 Independence and Dependence 78
4.5 The Binomial Probability Function 80
4.5.1 R Functions dbinom and pbinom 85
4.6 The Normal Distribution 85
4.6.1 Some Remarks about the Normal Distribution 88
4.6.2 The Standard Normal Distribution 89
4.6.3 Computing Probabilities for Any Normal Distribution 92
4.6.4 R Functions pnorm and qnorm 94
4.7 Nonnormality and The Population Variance 94
4.7.1 Skewed Distributions 97
4.7.2 Comments on Transforming Data 98
4.8 Summary 100
4.9 Exercises 101
5 Sampling Distributions 107
5.1 Sampling Distribution of ̂p, the Proportion of Successes 108
5.2 Sampling Distribution of the Mean Under Normality 111
5.2.1 Determining Probabilities Associated with the Sample Mean 113
5.2.2 But Typically 𝜎 Is Not Known. Now What? 116
5.3 Nonnormality and the Sampling Distribution of the Sample Mean 116
5.3.1 Approximating the Binomial Distribution 117
5.3.2 Approximating the Sampling Distribution of the Sample Mean: The General Case 119
5.4 Sampling Distribution of the Median and 20% Trimmed Mean 123
5.4.1 Estimating the Standard Error of the Median 126
5.4.2 R Function msmedse 127
5.4.3 Approximating the Sampling Distribution of the Sample Median 128
5.4.4 Estimating the Standard Error of a Trimmed Mean 129
5.4.5 R Function trimse 130
5.4.6 Estimating the Standard Error When Outliers Are Discarded: A Technically Unsound Approach 130
5.5 The Mean Versus the Median and 20% Trimmed Mean 131
5.6 Summary 135
5.7 Exercises 136
6 Confidence Intervals 139
6.1 Confidence Interval for the Mean 139
6.1.1 Computing a Confidence Interval Given 𝜎2 140
6.2 Confidence Intervals for the Mean Using s (𝜎 Not Known) 145
6.2.1 R Function t.test 148
6.3 A Confidence Interval for The Population Trimmed Mean 149
6.3.1 R Function trimci 150
6.4 Confidence Intervals for The Population Median 151
6.4.1 R Function msmedci 152
6.4.2 Underscoring a Basic Strategy 152
6.4.3 A Distribution-Free Confidence Interval for the Median Even When There Are Tied Values 153
6.4.4 R Function sint 154
6.5 The Impact of Nonnormality on Confidence Intervals 155
6.5.1 Student’s T and Nonnormality 155
6.5.2 Nonnormality and the 20% Trimmed Mean 161
6.5.3 Nonnormality and the Median 162
6.6 Some Basic Bootstrap Methods 163
6.6.1 The Percentile Bootstrap Method 163
6.6.2 R Functions trimpb 164
6.6.3 Bootstrap-t 164
6.6.4 R Function trimcibt 166
6.7 Confidence Interval for The Probability of Success 167
6.7.1 Agresti–Coull Method 169
6.7.2 Blyth’s Method 169
6.7.3 Schilling–Doi Method 170
6.7.4 R Functions acbinomci and binomLCO 170
6.8 Summary 172
6.9 Exercises 173
7 Hypothesis Testing 179
7.1 Testing Hypotheses about the Mean, 𝜎 Known 179
7.1.1 Details for Three Types of Hypotheses 180
7.1.2 Testing for Exact Equality and Tukey’s Three-Decision Rule 183
7.1.3 p-Values 184
7.1.4 Interpreting p-Values 186
7.1.5 Confidence Intervals versus Hypothesis Testing 187
7.2 Power and Type II Errors 187
7.2.1 Power and p-Values 191
7.3 Testing Hypotheses about the mean, 𝜎 Not Known 191
7.3.1 R Function t.test 193
7.4 Student’s T and Nonnormality 193
7.4.1 Bootstrap-t 195
7.4.2 Transforming Data 196
7.5 Testing Hypotheses about Medians 196
7.5.1 R Function msmedci and sintv2 197
7.6 Testing Hypotheses Based on a Trimmed Mean 198
7.6.1 R Functions trimci, trimcipb, and trimcibt 198
7.7 Skipped Estimators 200
7.7.1 R Function momci 200
7.8 Summary 201
7.9 Exercises 202
8 Correlation and Regression 207
8.1 Regression Basics 207
8.1.1 Residuals and a Method for Estimating the Median of Y Given X 209
8.1.2 R function qreg and Qreg 211
8.2 Least Squares Regression 212
8.2.1 R Functions lsfit, lm, ols, plot, and abline 214
8.3 Dealing with Outliers 215
8.3.1 Outliers among the Independent Variable 215
8.3.2 Dealing with Outliers among the Dependent Variable 216
8.3.3 R Functions tsreg and tshdreg 218
8.3.4 Extrapolation Can Be Dangerous 219
8.4 Hypothesis Testing 219
8.4.1 Inferences about the Least Squares Slope and Intercept 220
8.4.2 R Functions lm, summary, and ols 223
8.4.3 Heteroscedcasticity: Some Practical Concerns and How to Address Them 225
8.4.4 R Function olshc4 226
8.4.5 Outliers among the Dependent Variable: A Cautionary Note 227
8.4.6 Inferences Based on the Theil–Sen Estimator 227
8.4.7 R Functions regci and regplot 227
8.5 Correlation 229
8.5.1 Pearson’s Correlation 229
8.5.2 Inferences about the Population Correlation, 𝜌 232
8.5.3 R Functions pcor and pcorhc4 234
8.6 Detecting Outliers When Dealing with Two or More Variables 235
8.6.1 R Functions out and outpro 236
8.7 Measures of Association: Dealing with Outliers 236
8.7.1 Kendall’s Tau 236
8.7.2 R Functions tau and tauci 239
8.7.3 Spearman’s Rho 240
8.7.4 R Functions spear and spearci 241
8.7.5 Winsorized and Skipped Correlations 242
8.7.6 R Functions scor, scorci, scorciMC, wincor, and wincorci 243
8.8 Multiple Regression 245
8.8.1 Least Squares Regression 245
8.8.2 Hypothesis Testing 246
8.8.3 R Function olstest 248
8.8.4 Inferences Based on a Robust Estimator 248
8.8.5 R Function regtest 249
8.9 Dealing with Curvature 249
8.9.1 R Function lplot and rplot 251
8.10 Summary 256
8.11 Exercises 257
9 Comparing Two Independent Groups 263
9.1 Comparing Means 264
9.1.1 The Two-Sample Student’s T Test 264
9.1.2 Violating Assumptions When Using Student’s T 266
9.1.3 Why Testing Assumptions Can Be Unsatisfactory 269
9.1.4 Interpreting Student’s T When It Rejects 270
9.1.5 Dealing with Unequal Variances: Welch’s Test 271
9.1.6 R Function t.test 273
9.1.7 Student’s T versus Welch’s Test 274
9.1.8 The Impact of Outliers When Comparing Means 275
9.2 Comparing Medians 276
9.2.1 A Method Based on the McKean–Schrader Estimator 276
9.2.2 A Percentile Bootstrap Method 277
9.2.3 R Functions msmed, medpb2, split, and fac2list 278
9.2.4 An Important Issue: The Choice of Method can Matter 279
9.3 Comparing Trimmed Means 280
9.3.1 R Functions yuen, yuenbt, and trimpb2 282
9.3.2 Skipped Measures of Location and Deleting Outliers 283
9.3.3 R Function pb2gen 283
9.4 Tukey’s Three-Decision Rule 283
9.5 Comparing Variances 284
9.5.1 R Function comvar2 285
9.6 Rank-Based (Nonparametric) Methods 285
9.6.1 Wilcoxon–Mann–Whitney Test 286
9.6.2 R Function wmw 289
9.6.3 Handling Heteroscedasticity 289
9.6.4 R Functions cid and cidv2 290
9.7 Measuring Effect Size 291
9.7.1 Cohen’s d 292
9.7.2 Concerns about Cohen’s d and How They Might Be Addressed 293
9.7.3 R Functions akp.effect, yuenv2, and med.effect 295
9.8 Plotting Data 296
9.8.1 R Functions ebarplot, ebarplot.med, g2plot, and boxplot 298
9.9 Comparing Quantiles 299
9.9.1 R Function qcomhd 300
9.10 Comparing Two Binomial Distributions 301
9.10.1 Improved Methods 302
9.10.2 R Functions twobinom and twobicipv 302
9.11 A Method for Discrete or Categorical Data 303
9.11.1 R Functions disc2com, binband, and splotg2 304
9.12 Comparing Regression Lines 305
9.12.1 Classic ANCOVA 307
9.12.2 R Function CLASSanc 307
9.12.3 Heteroscedastic Methods for Comparing the Slopes and Intercepts 309
9.12.4 R Functions olsJ2 and ols2ci 309
9.12.5 Dealing with Outliers among the Dependent Variable 311
9.12.6 R Functions reg2ci, ancGpar, and reg2plot 311
9.12.7 A Closer Look at Comparing Nonparallel Regression Lines 313
9.12.8 R Function ancJN 313
9.13 Summary 315
9.14 Exercises 316
10 Comparing More than Two Independent Groups 321
10.1 The ANOVA F Test 321
10.1.1 R Functions anova, anova1, aov, split, and fac2list 327
10.1.2 When Does the ANOVA F Test Perform Well? 329
10.2 Dealing with Unequal Variances: Welch’s Test 331
10.3 Comparing Groups Based on Medians 333
10.3.1 R Functions med1way and Qanova 333
10.4 Comparing Trimmed Means 334
10.4.1 R Functions t1way and t1waybt 335
10.5 Two-Way ANOVA 335
10.5.1 Interactions 338
10.5.2 R Functions anova and aov 341
10.5.3 Violating Assumptions 342
10.5.4 R Functions t2way and t2waybt 343
10.6 Rank-Based Methods 344
10.6.1 The Kruskal–Wallis Test 344
10.6.2 Method BDM 346
10.7 R Functions kruskal.test AND bdm 347
10.8 Summary 348
10.9 Exercises 349
11 Comparing Dependent Groups 353
11.1 The Paired T Test 354
11.1.1 When Does the Paired T Test Perform Well? 356
11.1.2 R Functions t.test and trimcibt 357
11.2 Comparing Trimmed Means and Medians 357
11.2.1 R Functions yuend, ydbt, and dmedpb 359
11.2.2 Measures of Effect Size 363
11.2.3 R Functions D.akp.effect and effectg 364
11.3 The SIGN Test 364
11.3.1 R Function signt 365
11.4 Wilcoxon Signed Rank Test 365
11.4.1 R Function wilcox.test 367
11.5 Comparing Variances 367
11.5.1 R Function comdvar 368
11.6 Dealing with More Than Two Dependent Groups 368
11.6.1 Comparing Means 369
11.6.2 R Function aov 369
11.6.3 Comparing Trimmed Means 370
11.6.4 R Function rmanova 371
11.6.5 Rank-Based Methods 371
11.6.6 R Functions friedman.test and bprm 373
11.7 Between-By-Within Designs 373
11.7.1 R Functions bwtrim and bw2list 373
11.8 Summary 375
11.9 Exercises 376
12 Multiple Comparisons 379
12.1 Classic Methods for Independent Groups 380
12.1.1 Fisher’s Least Significant Difference Method 380
12.1.2 R Function FisherLSD 382
12.2 The Tukey–Kramer Method 382
12.2.1 Some Important Properties of the Tukey–Kramer Method 384
12.2.2 R Functions TukeyHSD and T.HSD 385
12.3 Scheffé’s Method 386
12.3.1 R Function Scheffe 386
12.4 Methods That Allow Unequal Population Variances 387
12.4.1 Dunnett’s T3 Method and an Extension of Yuen’s Method for Comparing Trimmed Means 387
12.4.2 R Functions lincon, linconbt, and conCON 389
12.5 Anova Versus Multiple Comparison Procedures 391
12.6 Comparing Medians 391
12.6.1 R Functions msmed, medpb, and Qmcp 392
12.7 Two-Way Anova Designs 393
12.7.1 R Function mcp2atm 397
12.8 Methods For Dependent Groups 400
12.8.1 Bonferroni Method 400
12.8.2 Rom’s Method 401
12.8.3 Hochberg’s Method 403
12.8.4 R Functions rmmcp, dmedpb, and sintmcp 403
12.8.5 Controlling the False Discovery Rate 404
12.9 Summary 405
12.10 Exercises 406
13 Categorical Data 409
13.1 One-Way Contingency Tables 409
13.1.1 R Function chisq.test 413
13.1.2 Gaining Perspective: A Closer Look at the Chi-Squared Distribution 413
13.2 Two-Way Contingency Tables 414
13.2.1 McNemar’s Test 414
13.2.2 R Functions contab and mcnemar.test 417
13.2.3 Detecting Dependence 418
13.2.4 R Function chi.test.ind 422
13.2.5 Measures of Association 422
13.2.6 The Probability of Agreement 423
13.2.7 Odds and Odds Ratio 424
13.3 Logistic Regression 426
13.3.1 R Function logreg 428
13.3.2 A Confidence Interval for the Odds Ratio 429
13.3.3 R Function ODDSR.CI 429
13.3.4 Smoothers for Logistic Regression 429
13.3.5 R Functions rplot.bin and logSM 430
13.4 Summary 431
13.5 Exercises 432
AppendixA Solutions to Selected Exercises 435
Appendix B Tables 441
References 465
Index 473
| Erscheinungsdatum | 11.07.2016 |
|---|---|
| Verlagsort | New York |
| Sprache | englisch |
| Maße | 155 x 239 mm |
| Gewicht | 862 g |
| Themenwelt | Geisteswissenschaften ► Psychologie |
| Mathematik / Informatik ► Mathematik ► Computerprogramme / Computeralgebra | |
| Mathematik / Informatik ► Mathematik ► Statistik | |
| Mathematik / Informatik ► Mathematik ► Wahrscheinlichkeit / Kombinatorik | |
| ISBN-10 | 1-119-06139-3 / 1119061393 |
| ISBN-13 | 978-1-119-06139-7 / 9781119061397 |
| Zustand | Neuware |
| Informationen gemäß Produktsicherheitsverordnung (GPSR) | |
| Haben Sie eine Frage zum Produkt? |
aus dem Bereich


