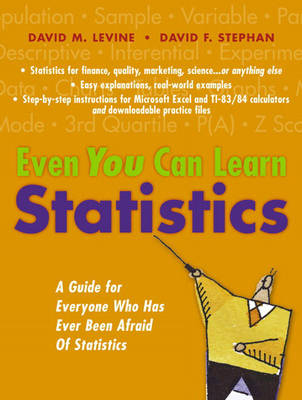
Even You Can Learn Statistics
Financial Times Prentice Hall (Verlag)
978-0-13-146757-6 (ISBN)
- Titel erscheint in neuer Auflage
- Artikel merken
Even You Can Learn StatisticsA Guide for Everyone Who Has Ever Been Afraid Of Statistics
One easy step at a time, this book will teach you the key statistical techniques you'll need for finance, quality, marketing, the social sciences, or just about any other field. Each technique is introduced with a simple, jargon-free explanation, practical examples, and hands-on guidance for solving real problems with Excel or a TI-83/84 series calculator, including Plus models. Hate math? No sweat. You'll be amazed how little you need! For those who do have an interest in mathematics, optional "Equation Blackboard" sections review the equations that provide the foundations for important concepts.
David M. Levine is a much-honored innovator in statistics education. He is Professor Emeritus of Statistics and Computer Information Systems at Bernard M. Baruch College (CUNY), and co-author of several best-selling books, including Statistics for Managers using Microsoft Excel, Basic Business Statistics, Quality Management, and Six Sigma for Green Belts and Champions.
Instructional designer David F. Stephan pioneered the classroom use of personal computers, and is a leader in making Excel more accessible to statistics students. He has co-authored several textbooks with David M. Levine.
Here's just some of what you'll learn how to do...
Use statistics in your everyday work or study
Perform common statistical tasks using a Texas Instruments statistical calculator or Microsoft Excel
Build and interpret statistical charts and tables
"Test Yourself" at the end of each chapter to review the concepts and methods that you learned in the chapter
Work with mean, median, mode, standard deviation, Z scores, skewness, and other descriptive statistics
Use probability and probability distributions
Work with sampling distributions and confidence intervals
Test hypotheses and decision-making risks with Z, t, Chi-Square, ANOVA, and other techniques
Perform regression analysis and modeling
The easy, practical introduction to statistics–for everyone!
Thought you couldn't learn statistics? Think again. You can–and you will!
Complementary Web site
Downloadable practice files at http://www.ftpress.com/youcanlearnstatistics
David M. Levine isone of the world’s leading innovators in statistics education. He isProfessor Emeritus of Statistics and Computer Information Systems at Bernard M.Baruch College (CUNY), and co-author of several best-selling books, including Statisticsfor Managers using Microsoft Excel, Quality Management, and Six Sigma for Green Belts andChampions. Instructional designer DavidF. Stephan pioneered the classroom use of technology, and is aleader in making Excel more accessible to statistics students. He hasco-authored several textbooks with David M. Levine.
Introduction.
1. Fundamentals of Statistics.
The Five Basic Words of Statistics.
Population.
Sample.
Parameter.
Statistic.
Variable.
The Branches of Statistics.
Descriptive Statistics.
Inferential Statistics.
Sources of Data.
Published Sources.
Experiments.
Surveys.
Sampling Concepts.
Sampling.
Probability Sampling.
Simple Random Sampling.
Frame.
Sample Selection Methods.
Sampling with Replacement.
Sampling without Replacement.
One-Minute Summary.
Test Yourself.
Answers to Test Yourself Questions.
References.
2. Presenting Data in Charts and Tables.
Presenting Categorical Data.
The Summary Table.
The Bar Chart.
The Pie Chart.
The Pareto Diagram.
Presenting Numerical Data.
The Frequency and Percentage Distribution.
Histogram.
The Dot Scale Diagram.
The Time-Series Plot.
The Scatter Plot.
Misusing Graphs.
One-Minute Summary.
Test Yourself.
Answers to Test Yourself Questions.
References.
3. Descriptive Statistics for Numerical Variables.
Measures of Central Tendency.
The Mean.
The Median.
The Mode.
Quartiles.
Measures of Variation.
The Range.
The Variance and the Standard Deviation.
Standard (Z) Scores.
Shape of Distributions.
Symmetrical Shape.
Left-Skewed Shape.
Right-Skewed Shape.
The Box-and-Whisker Plot.
Important Equations.
One-Minute Summary.
Test Yourself.
Answers to Test Yourself Questions.
References.
4. Probability.
Getting Started with Probability.
Event.
Elementary Event.
Random Variable.
Probability.
Collectively Exhaustive Events.
Some Rules of Probability.
Assigning Probabilities.
Classical Approach.
Empirical Approach.
Subjective Approach.
One-Minute Summary.
Test Yourself.
Answers to Test Yourself Questions.
References.
5. Probability Distributions.
Probability Distributions for Discrete Variables.
Discrete Probability Distribution.
The Expected Value of a Random Variable.
Standard Deviation of a Random Variable (_).
The Binomial and Poisson Probability Distributions.
The Binomial Distribution.
The Poisson Distribution.
Continuous Probability Distributions and the Normal Distribution.
Normal Distribution.
Using Standard Deviation Units.
Finding the Z Value from the Area Under the Normal Curve.
The Normal Probability Plot.
Important Equations.
One-Minute Summary.
Test Yourself.
Answers to Test Yourself Questions.
References.
6. Sampling Distributions and Confidence Intervals.
Sampling Distributions.
Sampling Distribution.
Sampling Distribution of the Mean and the Central Limit Theorem.
Sampling Distribution of the Proportion.
What You Need to Know About Sampling Distributions.
Sampling Error and Confidence Intervals.
Sampling Error.
Confidence Interval Estimate.
Confidence Interval Estimate for the Mean Using the t Distribution (_Unknown).
t Distribution.
Confidence Interval Estimation for the Proportion.
Important Equations.
One-Minute Summary.
Test Yourself.
Answers to Test Yourself Questions.
References.
7. Fundamentals of Hypothesis Testing.
The Null and Alternative Hypotheses.
Null Hypothesis.
Alternative Hypothesis.
Hypothesis Testing Issues.
Test Statistic.
Practical Significance Versus Statistical Significance.
Decision-Making Risks.
Type I Error.
Type II Error.
Risk Trade-Off.
Performing Hypothesis Testing.
The p-Value Approach to Hypothesis Testing.
p-Value.
Types of Hypothesis Tests.
Number of Groups.
Relationship Stated in Alternative Hypothesis H1.
Type of Variable.
One-Minute Summary.
Test Yourself.
Answers to Test Yourself Questions.
References.
8. Hypothesis Testing: Z and t Tests.
Testing for the Difference between Two Proportions.
Testing for the Difference Between the Means of Two Independent Groups.
Pooled-Variance t Test.
Pooled-Variance t Test Assumptions.
The Paired t Test.
Important Equations.
One-Minute Summary.
Test Yourself.
Answers to Test Yourself Questions.
References.
9. Hypothesis Testing: Chi-Square Tests and the One-Way Analysis of Variance (ANOVA).
Chi-Square Test for Two-Way Tables.
One-Way Analysis of Variance (ANOVA): Testing for the Differences among the Means of More Than Two Groups.
One-Way ANOVA.
The Three Variances of ANOVA.
ANOVA Summary Table.
One-Way ANOVA Assumptions.
Important Equations.
One-Minute Summary.
Test Yourself.
Answers to Test Yourself Questions.
References.
10. Regression Analysis.
Basics of Regression Analysis.
Simple Linear Regression.
Determining the Simple Linear Regression Equation.
Y intercept.
Slope.
Least-Squares Method.
Regression Model Prediction.
Measures of Variation.
Regression Sum of Squares (SSR).
Error Sum of Squares (SSE).
Total Sum of Squares (SST).
The Coefficient of Determination.
The Coefficient of Correlation.
Standard Error of the Estimate.
Regression Assumptions.
Residual Analysis.
Residual.
Evaluating the Assumptions.
Inferences About the Slope.
t Test for the Slope.
Confidence Interval Estimate of the Slope (_1).
Common Mistakes Using Regression Analysis.
Important Equations.
One-Minute Summary.
Test Yourself.
Answers to Test Yourself Questions.
References.
11. Quality and Six Sigma Management Applications of Statistics.
Total Quality Management.
Six Sigma Management.
Six Sigma.
The Six Sigma DMAIC Model.
Control Charts.
Special or Assignable Causes of Variation.
Chance or Common Causes of Variation.
Control Limits.
The p Chart.
The Parable of the Red Bead Experiment: Understanding Process Variability.
Deming’s Red Bead Experiment.
Variables Control Charts for the Mean and Range.
Important Equations.
One-Minute Summary.
Test Yourself.
Answers to Test Yourself Questions.
References.
Appendix A: TI Statistical Calculator Settings and Microsoft Excel Settings.
TI Statistical Calculator Settings.
“Ready State” Assumptions.
Menu Selections.
Statistical Function Entries by Menus.
Primary Key Legend Convention.
Mode Settings.
Calculator Clearing and Reset.
Data Storage.
Microsoft Excel Settings.
Appendix B: Review of Arithmetic and Algebra.
Assessment Quiz.
Part 1.
Part 2.
Symbols.
Addition.
Subtraction.
Multiplication.
Division.
Fractions.
Exponents and Square Roots.
Equations.
Answers to Quiz.
Part 1.
Part 2.
Appendix C: Statistical Tables.
The Cumulative Standardized Normal Distribution.
Critical Values of t.
Critical Values of _2.
Critical Values of F.
Control Chart Factors.
Appendix D: Using Microsoft Excel Wizards.
Using the Chart Wizard.
Choosing the Best Chart Options.
Using the PivotTable Wizard.
Using the Data Analysis Tools.
Simple Linear Regression.
Glossary.
Index.
| Erscheint lt. Verlag | 23.9.2004 |
|---|---|
| Verlagsort | Upper Saddle River |
| Sprache | englisch |
| Maße | 181 x 233 mm |
| Gewicht | 468 g |
| Themenwelt | Mathematik / Informatik ► Mathematik ► Finanz- / Wirtschaftsmathematik |
| Mathematik / Informatik ► Mathematik ► Statistik | |
| Wirtschaft ► Volkswirtschaftslehre ► Ökonometrie | |
| ISBN-10 | 0-13-146757-3 / 0131467573 |
| ISBN-13 | 978-0-13-146757-6 / 9780131467576 |
| Zustand | Neuware |
| Informationen gemäß Produktsicherheitsverordnung (GPSR) | |
| Haben Sie eine Frage zum Produkt? |
aus dem Bereich


