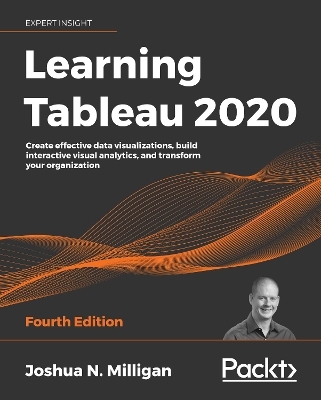
Learning Tableau 2020
Packt Publishing Limited (Verlag)
978-1-80020-036-4 (ISBN)
Publisher's note: This edition from 2020 is outdated and does not make use of the most recent Tableau features. A new fifth edition, updated for Tableau 2022, is now available.
Key Features
Explore the latest Tableau 2020 features and redefine business analytics for your firm
Understand visualizing data and creating interactive dashboards to gain meaningful insights
Learn implementing effective data storytelling to redefine how your business leverages data and makes decisions
Book DescriptionLearning Tableau strengthens your command on Tableau fundamentals and builds on advanced topics.
The book starts by taking you through foundational principles of Tableau. We then demonstrate various types of connections and how to work with metadata. We teach you to use a wide variety of visualizations to analyze and communicate the data, and introduce you to calculations and parameters. We then take an in-depth look at level of detail (LOD) expressions and use them to solve complex data challenges. Up next, we show table calculations, how to extend and alter default visualizations, build an interactive dashboard, and master the art of telling stories with data.
This Tableau book will introduce you to visual statistical analytics capabilities, create different types of visualizations and dynamic dashboards for rich user experiences. We then move on to maps and geospatial visualization, and the new Data Model capabilities introduced in Tableau 2020.2. You will further use Tableau Prep’s ability to clean and structure data and share the stories contained in your data.
By the end of this book, you will be proficient in implementing the powerful features of Tableau 2020 for decision-making.
What you will learn
Develop stunning visualizations to explain complex data with clarity
Explore exciting new Data Model capabilities
Connect to various data sources to bring all your data together
Leverage Tableau Prep Builder’s amazing capabilities for data cleaning and structuring
Create and use calculations to solve problems and enrich the analytics
Master advanced topics such as sets, LOD calculations, and much more
Enable smart decisions with data clustering, distribution, and forecasting
Share your data stories to build a culture of trust and action
Who this book is forThis Tableau book is for anyone who wants to understand data. If you're new to Tableau, don't worry. This book will simplify Tableau for beginners to build on the foundations to help you understand how Tableau really works and then builds on that knowledge with practical examples before moving on to advanced techniques.
Having a bit of background with data will help, but you don't need to know scripting, SQL or database structures.
Joshua Milligan is a Hall of Fame Tableau Zen Master and 2017 Iron Viz Global finalist. His passion is training, mentoring, and helping people gain insights and make decisions based on their data through data visualization using Tableau and data cleaning and structuring using Tableau Prep. He is a principal consultant at Teknion Data Solutions, where he has served clients in numerous industries since 2004. Joshua and his wife have four children and currently reside in Tulsa.
Table of Contents
Taking Off with Tableau
Connecting to Data in Tableau
Moving Beyond Basic Visualizations
Starting an Adventure with Calculations and Parameters
Leveraging Level of Detail Calculations
Diving Deep with Table Calculations
Making Visualizations That Look Great and Work Well
Telling a Data Story with Dashboards
Visual Analytics – Trends, Clustering, Distributions, and Forecasting
Advanced Visualizations
Dynamic Dashboards
Exploring Mapping and Advanced Geospatial Features
Understanding the Tableau Data Model, Joins, and Blends
Structuring Messy Data to Work Well in Tableau
Taming Data with Tableau Prep
Sharing Your Data Story
| Erscheinungsdatum | 07.09.2020 |
|---|---|
| Verlagsort | Birmingham |
| Sprache | englisch |
| Maße | 75 x 93 mm |
| Themenwelt | Informatik ► Software Entwicklung ► User Interfaces (HCI) |
| Wirtschaft ► Betriebswirtschaft / Management | |
| ISBN-10 | 1-80020-036-6 / 1800200366 |
| ISBN-13 | 978-1-80020-036-4 / 9781800200364 |
| Zustand | Neuware |
| Informationen gemäß Produktsicherheitsverordnung (GPSR) | |
| Haben Sie eine Frage zum Produkt? |
aus dem Bereich


