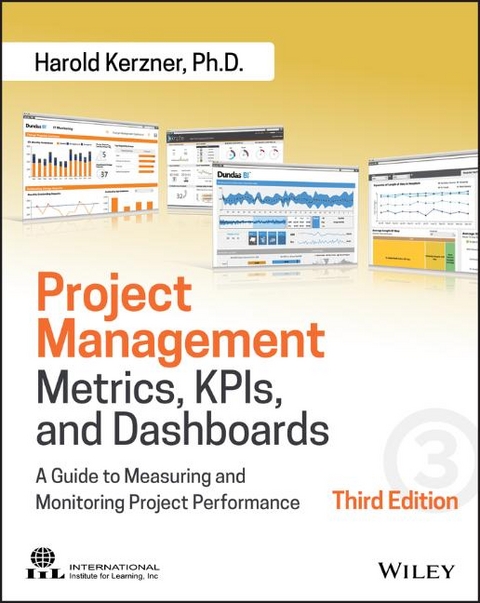
Project Management Metrics, KPIs, and Dashboards – A Guide to Measuring and Monitoring Project Performance, Third Edition
John Wiley & Sons Inc (Verlag)
978-1-119-42728-5 (ISBN)
- Titel erscheint in neuer Auflage
- Artikel merken
With the growth of complex projects, stakeholder involvement, and advancements in visual-based technology, metrics and KPIs (key performance indicators) are key factors in evaluating project performance. Dashboard reporting systems provide accessible project performance data, and sharing this vital data in a concise and consistent manner is a key communication responsibility of all project managers.
This third edition of Kerzner's groundbreaking work, Project Management Metrics, KPIs, and Dashboards: A Guide to Measuring and Monitoring Project Performance, helps functional managers gain a thorough grasp of what metrics and KPIs are and how to use them. Plus, this edition includes new sections on processing dashboard information, portfolio management PMO and metrics, and BI tool flexibility.
• Offers comprehensive coverage of the different dashboard types, design issues, and applications
Provides full-color dashboards from some of the most successful project management companies, including IBM, Microsoft, and others
Aligns with PMI’s PMBOK® Guide and stresses value-driven project management
PPT decks are available by chapter and a test bank will be available for use in seminar presentations and courses
Get ready to bolster your awareness of what good metrics management really entails today—and be armed with the knowledge to measure performance more effectively.
HAROLD KERZNER, PHD, is Senior Executive Director for Project Management at the International Institute for Learning, Inc. (IIL), a global learning solutions company offering professional training and consulting services worldwide. Dr. Kerzner's profound effect on the project management industry inspired IIL to establish, in coordination with the Project Management Institute (PMI), the Kerzner International Project Manager of the Year Award, which is presented to a distinguished PMP® credential holder or global equivalent each year. INTERNATIONAL INSTITUTE FOR LEARNING, INC. (IIL) is a global leader in professional training and comprehensive consulting services in the areas of project, program, and portfolio management, PRINCE2®, ITIL, Business Analysis, Microsoft® Office Project and Project Server, and Lean Six Sigma. IIL is an IIBA-endorsed education provider, a PMI® charter global registered education provider, and a member of PMI's Silver Alliance Circle and their Corporate Council.
PREFACE ix
1 The Changing Landscape of
Project Management 1
Chapter Overview 1
1.0 Introduction 1
1.1 Executive View of Project Management 2
1.2 Complex Projects 5
Comparing Traditional and Nontraditional Projects 5
Defining Complexity 8
Trade-offs 10
Skill Set 10
Governance 11
Decision Making 11
Fluid Methodologies 12
1.3 Global Project Management 12
1.4 Project Management Methodologies and Frameworks 14
Light Methodologies 16
Heavy Methodologies 17
Frameworks 17
1.5 The Need for Effective Governance 20
1.6 Engagement Project Management 20
1.7 Customer Relations Management 23
1.8 Other Developments in Project Management 23
1.9 A New Look at Defining Project Success 25
Success Is Measured by the Triple Constraints 25
Customer Satisfaction Must Be Considered as Well 26
Other (or Secondary) Factors Must Be Considered as Well 26
Success Must Include a Business Component 26
Prioritization of Success Constraints May Be Necessary 27
The Definition of Success Must Include a “Value” Component 28
Multiple Components for Success 29
The Future 30
1.10 The Growth of Paperless Project Management 30
1.11 Project Management Maturity and Metrics 32
1.12 Project Management Benchmarking and Metrics 36
Best Practice versus Proven Practice 37
Benchmarking Methodologies 38
1.13 Conclusions 42
2 The Driving Forces for Better Metrics 43
Chapter Overview 43
2.0 Introduction 43
2.1 Stakeholder Relations Management 44
2.2 Project Audits and the PMO 56
2.3 Introduction to Scope Creep 57
Defining Scope Creep 57
Scope Creep Dependencies 60
Causes of Scope Creep 60
Need for Business Knowledge 62
Business Side of Scope Creep 62
Ways to Minimize Scope Creep 63
2.4 Project Health Checks 64
Understanding Project Health Checks 65
Who Performs the Health Check? 67
Life Cycle Phases 67
2.5 Managing Distressed Projects 69
Root Causes of Failure 70
Definition of Failure 71
Early Warning Signs of Trouble 72
Selecting the Recovery Project Manager 73
Recovery Life Cycle Phases 74
3 Metrics 83
Chapter Overview 83
3.0 Introduction 83
3.1 Project Management Metrics: The Early Years 84
3.2 Project Management Metrics: Current View 87
Metrics and Small Companies 88
3.3 Metrics Management Myths 88
3.4 Selling Executives on a Metrics Management Program 89
3.5 Understanding Metrics 91
3.6 Causes for Lack of Support for Metrics Management 95
3.7 Using Metrics in Employee Performance Reviews 96
3.8 Characteristics of a Metric 97
3.9 Metric Categories and Types 99
3.10 Selecting the Metrics 101
3.11 Selecting a Metric/KPI Owner 105
3.12 Metrics and Information Systems 106
3.13 Critical Success Factors 106
3.14 Metrics and the PMO 109
3.15 Metrics and Project Oversight/ Governance 112
3.16 Metrics Traps 113
3.17 Promoting the Metrics 114
3.18 Churchill Downs Incorporated’s Project Performance Measurement Approaches 114
Toll Gates (Project Management–Related Progress and Performance Reporting) 116
4 Key Performance Indicators 121
Chapter Overview 121
4.0 Introduction 121
4.1 The Need for KPIs 122
4.2 Using the KPIs 126
4.3 The Anatomy of a KPI 128
4.4 KPI Characteristics 129
Accountability 130
Empowered 131
Timely 131
Trigger Points 131
Easy to Understand 132
Accurate 132
Relevant 133
Seven Strategies for Selecting Relevant Key Performance Indicators 134
Putting the R in KPI 135
Take First Prize 137
4.5 Categories of KPIs 137
4.6 KPI Selection 138
4.7 KPI Measurement 144
4.8 KPI Interdependencies 146
4.9 KPIs and Training 148
4.10 KPI Targets 149
4.11 Understanding Stretch Targets 152
4.12 KPI Failures 154
4.13 KPIs and Intellectual Capital 155
4.14 KPI Bad Habits 157
KPI Bad Habits Causing Your Performance Measurement Struggles 158
4.15 BrightPoint Consulting, Inc.—Dashboard Design: Key Performance Indicators and Metrics 163
Introduction 163
Metrics and Key Performance Indicators 164
Scorecards, Dashboards, and Reports 165
Gathering KPI and Metric Requirements for a Dashboard 166
Interviewing Business Users 166
Putting It All Together—The KPI Wheel 167
Start Anywhere, but Go Everywhere 167
Wheels Generate Other Wheels 170
A Word about Gathering Requirements and Business Users 170
Wrapping It All Up 171
5 Value-Based Project Management Metrics 173
Chapter Overview 173
5.0 Introduction 173
5.1 Value over the Years 175
5.2 Values and Leadership 176
5.3 Combining Success and Value 179
5.4 Recognizing the Need for Value Metrics 183
5.5 The Need for Effective Measurement Techniques 186
5.6 Customer/Stakeholder Impact on Value Metrics 191
5.7 Customer Value Management 192
5.8 T he Relationship between Project Management and Value 197
5.9 Background of Metrics 202
Redefining Success 203
Growth in the Use of Metrics 204
5.10 Selecting the Right Metrics 208
5.11 The Failure of Traditional Metrics and KPIs 212
5.12 The Need for Value Metrics 212
5.13 Creating a Value Metric 213
5.14 Presenting the Value Metric in a Dashboard 221
5.15 Industry Examples of Value Metrics 221
5.16 U se of Crisis Dashboards for Out-of-Range Value Attributes 227
5.17 Establishing a Metrics Management Program 228
5.18 Using Value Metrics for Forecasting 230
5.19 Metrics and Job Descriptions 232
5.20 Graphical Representation of Metrics 232
5.21 Creating a Project Value Baseline 245
The Performance Measurement Baseline 246
Project Value Management 246
The Value Management Baseline 247
Selecting the Value Baseline Attributes 250
6 Dashboards 253
Chapter Overview 253
6.0 Introduction 253
6.1 How We Process Dashboard Information 258
6.2 Dashboard Core Attributes 258
6.3 The Meaning of Information 259
6.4 Traffic Light Dashboard Reporting 261
6.5 Dashboards and Scorecards 263
Dashboards 264
Scorecards 264
Summary 264
6.6 Creating a Dashboard Is a Lot like Online Dating 266
Finding Out the Needs of the Stakeholders 266
Making a Connection 267
Choosing Your Key Performance Indicators 267
Selecting Your Visuals 268
Building on the Momentum 268
Maintenance 268
6.7 Benefits of Dashboards 269
6.8 Is Your BI Tool Flexible Enough? 269
A Flexible BI Tool–What Does It Mean and Why Does It Matter? 269
Why Is Flexibility So Important? 270
Stay Up to Speed with Your Changing Business Needs 271
Be Independent (with Fewer Tools and Users Involved to Get Your Job Done) 272
Adapt to Each and Every User 272
Be Ready for the Unknown 272
6.9 Rules for Dashboards 273
6.10 T he Seven Deadly Sins of Dashboard Design and Why They Should Be Avoided 273
Deadly Sin #1: Off the Page, Out of Mind 274
Deadly Sin #2: And This Means . . . What? 274
Deadly Sin #3: Right Data, Wrong Chart 274
Deadly Sin #4: Not Making the Right Arrangements 274
Deadly Sin #5: A Lack of Emphasis 275
Deadly Sin #6: Debilitating Detail 275
Deadly Sin #7: Not Crunching the Numbers 275
6.11 B rightPoint Consulting, Inc.: Designing Executive Dashboards 276
Introduction 276
Dashboard Design Goals 276
Defining Key Performance Indicators 277
Defining Supporting Analytics 277
Choosing the Correct KPI Visualization Components 278
Supporting Analytics 280
Validating Your Design 283
6.12 All That Glitters Is Not Gold 285
6.13 Using Emoticons 309
6.14 Misleading Indicators 311
6.15 Agile and Scrum Metrics 312
6.16 Data Warehouses 314
6.17 Dashboard Design Tips 315
Colors 315
Fonts and font size 316
Use Screen Real Estate 316
Component Placement 317
6.18 TeamQuest Corporation 317
White Paper #1: Metric Dashboard Design 318
White Paper #2: Proactive Metrics Management 329
6.19 Logi Analytics, Inc.: Dashboard Best Practices 338
Executive Summary 338
Introduction—What’s New about Dashboards? 340
How Modern Is the Modern Dashboard? 340
The Dashboard versus the Spreadsheet 342
Designing the Dashboard 342
The Business-Driven Dashboard 343
The Implications for the IT Provider 345
Implementing the Dashboard 345
Organizational Challenges 346
Common Pitfalls 347
Justifying the Dashboard 348
Return on Investment 348
Ensuring Service-Level Agreements 349
Conclusion 349
6.20 A Simple Template 350
6.21 Summary of Dashboard Design Requirements 350
The Importance of Design to Information Dashboards 350
The Rules for Color Usage on Your Dashboard 353
The Rules for Graphic Design of Your Dashboard 355
The Rules for Placing the Dashboard in Front of Your Users—The Key to User Adoption 356
The Rules for Accuracy of Information on Your Dashboard 357
6.22 Dashboard Limitations 357
6.23 The Dashboard Pilot Run 360
6.24 Evaluating Dashboard Vendors 361
6.25 New Dashboard Applications 363
7 Dashboard Applications 365
Chapter Overview 365
7.0 Introduction 365
7.1 D ashboards in Action: Dundas Data Visualization 366
7.2 Dashboards in Action: PieMatrix, Inc. 366
7.3 PieMatrix Overview 378
PieMatrix Executive Dashboard 378
Executive Dashboard and To-Do List—Where Does All This Data Come From? 389
Project—Governing and Executing Complex Projects in a Visual and Friendly Way 392
Project—Planning the Project 396
Project—Breaking Down Silos 399
Authoring—Where the Best Practice Content Comes From 405
From Authoring Back to the Executive Dashboard 405
7.4 D ashboards in Action: International Institute for Learning 408
8 The Portfolio Management PMO and Metrics 413
Chapter Overview 413
8.0 Introduction 413
8.1 Critical Questions 414
8.2 Value Categories 414
8.3 Portfolio Metrics 416
8.4 Measurement Techniques and Metrics 419
8.5 Crisis Dashboards 419
Defining a Crisis 420
Index 425
| Erscheinungsdatum | 08.11.2017 |
|---|---|
| Verlagsort | New York |
| Sprache | englisch |
| Maße | 188 x 230 mm |
| Gewicht | 878 g |
| Themenwelt | Technik ► Elektrotechnik / Energietechnik |
| Technik ► Maschinenbau | |
| Wirtschaft ► Betriebswirtschaft / Management ► Allgemeines / Lexika | |
| Wirtschaft ► Betriebswirtschaft / Management ► Projektmanagement | |
| ISBN-10 | 1-119-42728-2 / 1119427282 |
| ISBN-13 | 978-1-119-42728-5 / 9781119427285 |
| Zustand | Neuware |
| Informationen gemäß Produktsicherheitsverordnung (GPSR) | |
| Haben Sie eine Frage zum Produkt? |
aus dem Bereich


