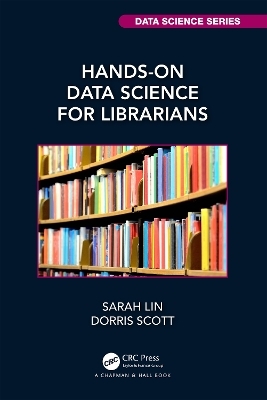
Hands-On Data Science for Librarians
Seiten
2023
Chapman & Hall/CRC (Verlag)
978-1-032-08082-6 (ISBN)
Chapman & Hall/CRC (Verlag)
978-1-032-08082-6 (ISBN)
Librarians understand the need to store, use and analyze data related to their collection, patrons and institution, and there has been consistent interest over the last 10 years to improve data management, analysis, and visualization skills within the profession. However, librarians find it difficult to move from out-of-the-box proprietary software applications to the skills necessary to perform the range of data science actions in code. This book will focus on teaching R through relevant examples and skills that librarians need in their day-to-day lives that includes visualizations but goes much further to include web scraping, working with maps, creating interactive reports, machine learning, and others. While there’s a place for theory, ethics, and statistical methods, librarians need a tool to help them acquire enough facility with R to utilize data science skills in their daily work, no matter what type of library they work at (academic, public or special). By walking through each skill and its application to library work before walking the reader through each line of code, this book will support librarians who want to apply data science in their daily work. Hands-On Data Science for Librarians is intended for librarians (and other information professionals) in any library type (public, academic or special) as well as graduate students in library and information science (LIS).
Key Features:
Only data science book available geared toward librarians that includes step-by-step code examples
Examples include all library types (public, academic, special)
Relevant datasets
Accessible to non-technical professionals
Focused on job skills and their applications
Key Features:
Only data science book available geared toward librarians that includes step-by-step code examples
Examples include all library types (public, academic, special)
Relevant datasets
Accessible to non-technical professionals
Focused on job skills and their applications
Sarah Lin is the Senior Information & Content Architect at MongoDB. Dorris Scott, PhD is the Academic Director of Data Studies at Washington University in St. Louis.
1. Introduction 2. Using RStudio’s IDE 3. Tidying data with dplyr 4. Visualizing your project with ggplot2 5. Webscraping with rvest 6. Mapping with tmap 7. Textual Analysis with tidytext 8. Creating Dynamic Documents with rmarkdown 9. Creating a flexdashboard 10. Creating an interactive dashboard with shiny 11. Using tidymodels to Understand Machine Learning 12. Conclusion Appendix A. Dependencies Appendix B. Additional Skills
| Erscheinungsdatum | 20.04.2023 |
|---|---|
| Reihe/Serie | Chapman & Hall/CRC Data Science Series |
| Zusatzinfo | 1 Tables, color; 9 Line drawings, color; 33 Line drawings, black and white; 26 Halftones, color; 35 Illustrations, color; 33 Illustrations, black and white |
| Sprache | englisch |
| Maße | 156 x 234 mm |
| Gewicht | 299 g |
| Themenwelt | Mathematik / Informatik ► Mathematik ► Computerprogramme / Computeralgebra |
| Sozialwissenschaften ► Kommunikation / Medien ► Buchhandel / Bibliothekswesen | |
| ISBN-10 | 1-032-08082-5 / 1032080825 |
| ISBN-13 | 978-1-032-08082-6 / 9781032080826 |
| Zustand | Neuware |
| Haben Sie eine Frage zum Produkt? |
Mehr entdecken
aus dem Bereich
aus dem Bereich
Buch | Softcover (2024)
SAGE Publications Inc (Verlag)
72,30 €
An Introduction
Buch | Hardcover (2023)
SAGE Publications Ltd (Verlag)
144,65 €


