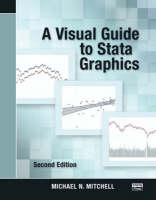
A Visual Guide to Stata Graphics, Second Edition
Stata Press (Verlag)
978-1-59718-039-9 (ISBN)
- Titel erscheint in neuer Auflage
- Artikel merken
Reflecting the new graphics features of Stata, this thoroughly updated and expanded edition contains a new chapter that explains how to exploit the power of the new Graph Editor. This edition also includes additional examples and illustrates nearly every example with the Graph Editor.
INTRODUCTION
Using this book
Types of Stata graphs
Schemes
Options
Building graphs
Editor
Overview of the Graph Editor
Object browser
Modifying objects
Adding objects
Moving objects
Hiding and showing objects
Locking and unlocking objects
Using the graph recorder
Graph Editor versus Stata commands
TWOWAY GRAPHS
Scatterplots
Regression fits and splines
Regression confidence interval fits
Line plots
Area plots
Bar plots
Range plots
Distribution plots
Options
Overlaying plots
SCATTERPLOT MATRIX GRAPHS
Marker options
Controlling axes
Matrix options
Graphing by groups
BAR GRAPHS
Y variables
Graphing bars over groups
Options for controlling gaps between bars
Options for sorting bars
Controlling the categorical axis
Legends and labeling bars
Controlling the y axis
Changing the look of bars
Graphing by groups
BOX PLOTS
Specifying variables and groups
Options for controlling groups between boxes
Options for sorting boxes
Controlling the categorical axis
Controlling legends
Controlling the y axis
Changing the look of boxes
Graphing by groups
DOT PLOTS
Specifying variables and groups
Options for controlling groups between dots
Options for sorting dots
Controlling the categorical axis
Controlling legends
Controlling the y axis
Changing the look of dot rulers
Graphing by groups
PIE GRAPHS
Types of pie graphs
Sorting pie slices
Changing the look and color of exploding pie slices
Slice labels
Controlling legends
Graphing by groups
OPTIONS AVAILABLE FOR MOST GRAPHS
Changing the look of markers
Creating and controlling marker labels
Connecting points and markers
Setting and controlling axis titles
Setting and controlling axis labels
Controlling axis scales
Selecting an axis
Graphing by groups
Controlling legends
Adding text to markers and positions
More options for text and textboxes
STANDARD OPTIONS AVAILABLE FOR ALL GRAPHS
Creating and controlling titles
Using schemes to control the look of graphs
Sizing graphs and their elements
Changing the look of graph regions
STYLES FOR CHANGING THE LOOK OF GRAPHS
Angles
Colors
Clock position
Compass direction
Connecting points
Line patterns
Line width
Margins
Marker size
Orientation
Marker symbols
Text size
APPENDIX
Overview of statistical graph commands,
Common options for statistical graphs
Saving, redisplaying, and combining graphs
More examples: putting it all together
Common mistakes
Customizing schemes
Online supplements
Subject Index
| Erscheint lt. Verlag | 5.7.2008 |
|---|---|
| Verlagsort | College Station |
| Sprache | englisch |
| Maße | 187 x 235 mm |
| Gewicht | 998 g |
| Themenwelt | Mathematik / Informatik ► Informatik ► Datenbanken |
| ISBN-10 | 1-59718-039-4 / 1597180394 |
| ISBN-13 | 978-1-59718-039-9 / 9781597180399 |
| Zustand | Neuware |
| Informationen gemäß Produktsicherheitsverordnung (GPSR) | |
| Haben Sie eine Frage zum Produkt? |
aus dem Bereich


