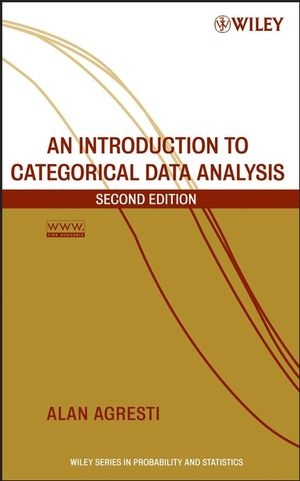
An Introduction to Categorical Data Analysis
John Wiley & Sons Inc (Verlag)
978-0-471-22618-5 (ISBN)
- Titel erscheint in neuer Auflage
- Artikel merken
Praise for the First Edition "This is a superb text from which to teach categorical data analysis, at a variety of levels...[t]his book can be very highly recommended." -Short Book Reviews "Of great interest to potential readers is the variety of fields that are represented in the examples: health care, financial, government, product marketing, and sports, to name a few." -Journal of Quality Technology "Alan Agresti has written another brilliant account of the analysis of categorical data." -The Statistician The use of statistical methods for categorical data is ever increasing in today's world. An Introduction to Categorical Data Analysis, Second Edition provides an applied introduction to the most important methods for analyzing categorical data. This new edition summarizes methods that have long played a prominent role in data analysis, such as chi-squared tests, and also places special emphasis on logistic regression and other modeling techniques for univariate and correlated multivariate categorical responses.
This Second Edition features:* Two new chapters on the methods for clustered data, with an emphasis on generalized estimating equations (GEE) and random effects models* A unified perspective based on generalized linear models* An emphasis on logistic regression modeling* An appendix that demonstrates the use of SAS(r) for all methods* An entertaining historical perspective on the development of the methods* Specialized methods for ordinal data, small samples, multicategory data, and matched pairs* More than 100 analyses of real data sets and nearly 300 exercises Written in an applied, nontechnical style, the book illustrates methods using a wide variety of real data, including medical clinical trials, drug use by teenagers, basketball shooting, horseshoe crab mating, environmental opinions, correlates of happiness, and much more. An Introduction to Categorical Data Analysis, Second Edition is an invaluable tool for social, behavioral, and biomedical scientists, as well as researchers in public health, marketing, education, biological and agricultural sciences, and industrial quality control.
ALAN AGRESTI, PhD, is Distinguished Professor Emeritus in the Department of Statistics at the University of Florida. He has presented short courses on categorical data methods in thirty countries. Dr. Agresti was named "Statistician of the Year" by the Chicago chapter of the American Statistical Association in 2003. He is the author of two advanced texts, including the bestselling Categorical Data Analysis (Wiley) and is also the coauthor of Statistics: The Art and Science of Learning from Data and Statistical Methods for the Social Sciences.
Preface to the Second Edition. 1. Introduction. 1.1 Categorical Response Data. 1.1.1 Response/Explanatory Variable Distinction. 1.1.2 Nominal/Ordinal Scale Distinction. 1.1.3 Organization of this Book. 1.2 Probability Distributions for Categorical Data. 1.2.1 Binomial Distribution. 1.2.2 Multinomial Distribution. 1.3 Statistical Inference for a Proportion. 1.3.1 Likelihood Function and Maximum Likelihood Estimation. 1.3.2 Significance Test About a Binomial Proportion. 1.3.3 Example: Survey Results on Legalizing Abortion. 1.3.4 Confidence Intervals for a Binomial Proportion. 1.4 More on Statistical Inference for Discrete Data. 1.4.1 Wald, Likelihood-Ratio, and Score Inference. 1.4.2 Wald, Score, and Likelihood-Ratio Inference for Binomial Parameter. 1.4.3 Small-Sample Binomial Inference. 1.4.4 Small-Sample Discrete Inference is Conservative. 1.4.5 Inference Based on the Mid P-value. 1.4.6 Summary. Problems. 2. Contingency Tables. 2.1 Probability Structure for Contingency Tables. 2.1.1 Joint, Marginal, and Conditional Probabilities. 2.1.2 Example: Belief in Afterlife. 2.1.3 Sensitivity and Specificity in Diagnostic Tests. 2.1.4 Independence. 2.1.5 Binomial and Multinomial Sampling. 2.2 Comparing Proportions in Two-by-Two Tables. 2.2.1 Difference of Proportions. 2.2.2 Example: Aspirin and Heart Attacks. 2.2.3 Relative Risk. 2.3 The Odds Ratio. 2.3.1 Properties of the Odds Ratio. 2.3.2 Example: Odds Ratio for Aspirin Use and Heart Attacks. 2.3.3 Inference for Odds Ratios and Log Odds Ratios. 2.3.4 Relationship Between Odds Ratio and Relative Risk. 2.3.5 The Odds Ratio Applies in Case-Control Studies. 2.3.6 Types of Observational Studies. 2.4 Chi-Squared Tests of Independence. 2.4.1 Pearson Statistic and the Chi-Squared Distribution. 2.4.2 Likelihood-Ratio Statistic. 2.4.3 Tests of Independence. 2.4.4 Example: Gender Gap in Political Affiliation. 2.4.5 Residuals for Cells in a Contingency Table. 2.4.6 Partitioning Chi-Squared. 2.4.7 Comments About Chi-Squared Tests. 2.5 Testing Independence for Ordinal Data. 2.5.1 Linear Trend Alternative to Independence. 2.5.2 Example: Alcohol Use and Infant Malformation. 2.5.3 Extra Power with Ordinal Tests. 2.5.4 Choice of Scores. 2.5.5 Trend Tests for I x 2 and 2 x J Tables. 2.5.6 Nominal-Ordinal Tables. 2.6 Exact Inference for Small Samples. 2.6.1 Fisher's Exact Test for 2 x 2 Tables. 2.6.2 Example: Fisher's Tea Taster. 2.6.3 P-values and Conservatism for Actual P(Type I Error). 2.6.4 Small-Sample Confidence Interval for Odds Ratio. 2.7 Association in Three-Way Tables. 2.7.1 Partial Tables. 2.7.2 Conditional Versus Marginal Associations: Death Penalty Example. 2.7.3 Simpson's Paradox. 2.7.4 Conditional and Marginal Odds Ratios. 2.7.5 Conditional Independence Versus Marginal Independence. 2.7.6 Homogeneous Association. Problems. 3. Generalized Linear Models. 3.1 Components of a Generalized Linear Model. 3.1.1 Random Component. 3.1.2 Systematic Component. 3.1.3 Link Function. 3.1.4 Normal GLM. 3.2 Generalized Linear Models for Binary Data. 3.2.1 Linear Probability Model. 3.2.2 Example: Snoring and Heart Disease. 3.2.3 Logistic Regression Model. 3.2.4 Probit Regression Model. 3.2.5 Binary Regression and Cumulative Distribution Functions. 3.3 Generalized Linear Models for Count Data. 3.3.1 Poisson Regression. 3.3.2 Example: Female Horseshoe Crabs and their Satellites. 3.3.3 Overdispersion: Greater Variability than Expected. 3.3.4 Negative Binomial Regression. 3.3.5 Count Regression for Rate Data. 3.3.6 Example: British Train Accidents over Time. 3.4 Statistical Inference and Model Checking. 3.4.1 Inference about Model Parameters. 3.4.2 Example: Snoring and Heart Disease Revisited. 3.4.3 The Deviance. 3.4.4 Model Comparison Using the Deviance. 3.4.5 Residuals Comparing Observations to the Model Fit. 3.5 Fitting Generalized Linear Models. 3.5.1 The Newton-Raphson Algorithm Fits GLMs. 3.5.2 Wald, Likelihood-Ratio, and Score Inference Use the Likelihood Function. 3.5.3 Advantages of GLMs. Problems. 4. Logistic Regression. 4.1 Interpreting the Logistic Regression Model. 4.1.1 Linear Approximation Interpretations. 4.1.2 Horseshoe Crabs: Viewing and Smoothing a Binary Outcome. 4.1.3 Horseshoe Crabs: Interpreting the Logistic Regression Fit. 4.1.4 Odds Ratio Interpretation. 4.1.5 Logistic Regression with Retrospective Studies. 4.1.6 Normally Distributed X Implies Logistic Regression for Y. 4.2 Inference for Logistic Regression. 4.2.1 Binary Data can be Grouped or Ungrouped. 4.2.2 Confidence Intervals for Effects. 4.2.3 Significance Testing. 4.2.4 Confidence Intervals for Probabilities. 4.2.5 Why Use a Model to Estimate Probabilities? 4.2.6 Confidence Intervals for Probabilities: Details. 4.2.7 Standard Errors of Model Parameter Estimates. 4.3 Logistic Regression with Categorical Predictors. 4.3.1 Indicator Variables Represent Categories of Predictors. 4.3.2 Example: AZT Use and AIDS. 4.3.3 ANOVA-Type Model Representation of Factors. 4.3.4 The Cochran-Mantel-Haenszel Test for 2 x 2 x K Contingency Tables. 4.3.5 Testing the Homogeneity of Odds Ratios. 4.4 Multiple Logistic Regression. 4.4.1 Example: Horseshoe Crabs with Color andWidth Predictors. 4.4.2 Model Comparison to Check Whether a Term is Needed. 4.4.3 Quantitative Treatment of Ordinal Predictor. 4.4.4 Allowing Interaction. 4.5 Summarizing Effects in Logistic Regression. 4.5.1 Probability-Based Interpretations. 4.5.2 Standardized Interpretations. Problems. 5. Building and Applying Logistic Regression Models. 5.1 Strategies in Model Selection. 5.1.1 How Many Predictors CanYou Use? 5.1.2 Example: Horseshoe Crabs Revisited. 5.1.3 Stepwise Variable Selection Algorithms. 5.1.4 Example: Backward Elimination for Horseshoe Crabs. 5.1.5 AIC, Model Selection, and the "Correct" Model. 5.1.6 Summarizing Predictive Power: Classification Tables. 5.1.7 Summarizing Predictive Power: ROC Curves. 5.1.8 Summarizing Predictive Power: A Correlation. 5.2 Model Checking. 5.2.1 Likelihood-Ratio Model Comparison Tests. 5.2.2 Goodness of Fit and the Deviance. 5.2.3 Checking Fit: Grouped Data, Ungrouped Data, and Continuous Predictors. 5.2.4 Residuals for Logit Models. 5.2.5 Example: Graduate Admissions at University of Florida. 5.2.6 Influence Diagnostics for Logistic Regression. 5.2.7 Example: Heart Disease and Blood Pressure. 5.3 Effects of Sparse Data. 5.3.1 Infinite Effect Estimate: Quantitative Predictor. 5.3.2 Infinite Effect Estimate: Categorical Predictors. 5.3.3 Example: Clinical Trial with Sparse Data. 5.3.4 Effect of Small Samples on X2 and G2 Tests. 5.4 Conditional Logistic Regression and Exact Inference. 5.4.1 Conditional Maximum Likelihood Inference. 5.4.2 Small-Sample Tests for Contingency Tables. 5.4.3 Example: Promotion Discrimination. 5.4.4 Small-Sample Confidence Intervals for Logistic Parameters and Odds Ratios. 5.4.5 Limitations of Small-Sample Exact Methods. 5.5 Sample Size and Power for Logistic Regression. 5.5.1 Sample Size for Comparing Two Proportions. 5.5.2 Sample Size in Logistic Regression. 5.5.3 Sample Size in Multiple Logistic Regression. Problems. 6. Multicategory Logit Models. 6.1 Logit Models for Nominal Responses. 6.1.1 Baseline-Category Logits. 6.1.2 Example: Alligator Food Choice. 6.1.3 Estimating Response Probabilities. 6.1.4 Example: Belief in Afterlife. 6.1.5 Discrete Choice Models. 6.2 Cumulative Logit Models for Ordinal Responses. 6.2.1 Cumulative Logit Models with Proportional Odds Property. 6.2.2 Example: Political Ideology and Party Affiliation. 6.2.3 Inference about Model Parameters. 6.2.4 Checking Model Fit. 6.2.5 Example: Modeling Mental Health. 6.2.6 Interpretations Comparing Cumulative Probabilities. 6.2.7 Latent Variable Motivation. 6.2.8 Invariance to Choice of Response Categories. 6.3 Paired-Category Ordinal Logits. 6.3.1 Adjacent-Categories Logits. 6.3.2 Example: Political Ideology Revisited. 6.3.3 Continuation-Ratio Logits. 6.3.4 Example: A Developmental Toxicity Study. 6.3.5 Overdispersion in Clustered Data. 6.4 Tests of Conditional Independence. 6.4.1 Example: Job Satisfaction and Income. 6.4.2 Generalized Cochran-Mantel-Haenszel Tests. 6.4.3 Detecting Nominal-Ordinal Conditional Association. 6.4.4 Detecting Nominal-Nominal Conditional Association. Problems. 7. Loglinear Models for Contingency Tables. 7.1 Loglinear Models for Two-Way and Three-Way Tables. 7.1.1 Loglinear Model of Independence for Two-Way Table. 7.1.2 Interpretation of Parameters in Independence Model. 7.1.3 Saturated Model for Two-Way Tables. 7.1.4 Loglinear Models for Three-Way Tables. 7.1.5 Two-Factor Parameters Describe Conditional Associations. 7.1.6 Example: Alcohol, Cigarette, and Marijuana Use. 7.2 Inference for Loglinear Models. 7.2.1 Chi-Squared Goodness-of-Fit Tests. 7.2.2 Loglinear Cell Residuals. 7.2.3 Tests about Conditional Associations. 7.2.4 Confidence Intervals for Conditional Odds Ratios. 7.2.5 Loglinear Models for Higher Dimensions. 7.2.6 Example: Automobile Accidents and Seat Belts. 7.2.7 Three-Factor Interaction. 7.2.8 Large Samples and Statistical vs Practical Significance. 7.3 The Loglinear-Logistic Connection. 7.3.1 Using Logistic Models to Interpret Loglinear Models. 7.3.2 Example: Auto Accident Data Revisited. 7.3.3 Correspondence Between Loglinear and Logistic Models. 7.3.4 Strategies in Model Selection. 7.4 Independence Graphs and Collapsibility. 7.4.1 Independence Graphs. 7.4.2 Collapsibility Conditions for Three-Way Tables. 7.4.3 Collapsibility and Logistic Models. 7.4.4 Collapsibility and Independence Graphs for Multiway Tables. 7.4.5 Example: Model Building for Student Drug Use. 7.4.6 Graphical Models. 7.5 Modeling Ordinal Associations. 7.5.1 Linear-by-Linear Association Model. 7.5.2 Example: Sex Opinions. 7.5.3 Ordinal Tests of Independence. Problems. 8. Models for Matched Pairs. 8.1 Comparing Dependent Proportions. 8.1.1 McNemar Test Comparing Marginal Proportions. 8.1.2 Estimating Differences of Proportions. 8.2 Logistic Regression for Matched Pairs. 8.2.1 Marginal Models for Marginal Proportions. 8.2.2 Subject-Specific and Population-Averaged Tables. 8.2.3 Conditional Logistic Regression for Matched-Pairs. 8.2.4 Logistic Regression for Matched Case-Control Studies. 8.2.5 Connection between McNemar and Cochran-Mantel-Haenszel Tests. 8.3 Comparing Margins of Square Contingency Tables. 8.3.1 Marginal Homogeneity and Nominal Classifications. 8.3.2 Example: Coffee Brand Market Share. 8.3.3 Marginal Homogeneity and Ordered Categories. 8.3.4 Example: Recycle or Drive Less to Help Environment? 8.4 Symmetry and Quasi-Symmetry Models for Square Tables. 8.4.1 Symmetry as a Logistic Model. 8.4.2 Quasi-Symmetry. 8.4.3 Example: Coffee Brand Market Share Revisited. 8.4.4 Testing Marginal Homogeneity Using Symmetry and Quasi-Symmetry. 8.4.5 An Ordinal Quasi-Symmetry Model. 8.4.6 Example: Recycle or Drive Less? 8.4.7 Testing Marginal Homogeneity Using Symmetry and Ordinal Quasi-Symmetry. 8.5 Analyzing Rater Agreement. 8.5.1 Cell Residuals for Independence Model. 8.5.2 Quasi-independence Model. 8.5.3 Odds Ratios Summarizing Agreement. 8.5.4 Quasi-Symmetry and Agreement Modeling. 8.5.5 Kappa Measure of Agreement. 8.6 Bradley-Terry Model for Paired Preferences. 8.6.1 The Bradley-Terry Model. 8.6.2 Example: Ranking Men Tennis Players. Problems. 9. Modeling Correlated, Clustered Responses. 9.1 Marginal Models Versus Conditional Models. 9.1.1 Marginal Models for a Clustered Binary Response. 9.1.2 Example: Longitudinal Study of Treatments for Depression. 9.1.3 Conditional Models for a Repeated Response. 9.2 Marginal Modeling: The GEE Approach. 9.2.1 Quasi-Likelihood Methods. 9.2.2 Generalized Estimating Equation Methodology: Basic Ideas. 9.2.3 GEE for Binary Data: Depression Study. 9.2.4 Example: Teratology Overdispersion. 9.2.5 Limitations of GEE Compared with ML. 9.3 Extending GEE: Multinomial Responses. 9.3.1 Marginal Modeling of a Clustered Multinomial Response. 9.3.2 Example: Insomnia Study. 9.3.3 AnotherWay of Modeling Association with GEE. 9.3.4 Dealing with Missing Data. 9.4 Transitional Modeling, Given the Past. 9.4.1 Transitional Models with Explanatory Variables. 9.4.2 Example: Respiratory Illness and Maternal Smoking. 9.4.3 Comparisons that Control for Initial Response. 9.4.4 Transitional Models Relate to Loglinear Models. Problems. 10. Random Effects: Generalized Linear Mixed Models. 10.1 Random Effects Modeling of Clustered Categorical Data. 10.1.1 The Generalized Linear Mixed Model. 10.1.2 A Logistic GLMM for Binary Matched Pairs. 10.1.3 Example: Sacrifices for the Environment Revisited. 10.1.4 Differing Effects in Conditional Models and Marginal Models. 10.2 Examples of Random Effects Models for Binary Data. 10.2.1 Small-Area Estimation of Binomial Probabilities. 10.2.2 Example: Estimating Basketball Free Throw Success. 10.2.3 Example: Teratology Overdispersion Revisited. 10.2.4 Example: Repeated Responses on Similar Survey Items. 10.2.5 Item Response Models: The Rasch Model. 10.2.6 Example: Depression Study Revisited. 10.2.7 Choosing Marginal or Conditional Models. 10.2.8 Conditional Models: Random Effects Versus Conditional ML. 10.3 Extensions to Multinomial Responses or Multiple Random Effect Terms. 10.3.1 Example: Insomnia Study Revisited. 10.3.2 Bivariate Random Effects and Association Heterogeneity. 10.4 Multilevel (Hierarchical) Models. 10.4.1 Example: Two-Level Model for Student Advancement. 10.4.2 Example: Grade Retention. 10.5 Model Fitting and Inference for GLMMS. 10.5.1 Fitting GLMMs. 10.5.2 Inference for Model Parameters and Prediction. Problems. 11. A Historical Tour of Categorical Data Analysis. 11.1 The Pearson-Yule Association Controversy. 11.2 R. A. Fisher's Contributions. 11.3 Logistic Regression. 11.4 Multiway Contingency Tables and Loglinear Models. 11.5 Final Comments. Appendix A: Software for Categorical Data Analysis. Appendix B: Chi-Squared Distribution Values. Bibliography. Index of Examples. Subject Index. Brief Solutions to Some Odd-Numbered Problems.
| Erscheint lt. Verlag | 17.4.2007 |
|---|---|
| Reihe/Serie | Wiley Series in Probability and Statistics |
| Verlagsort | New York |
| Sprache | englisch |
| Maße | 165 x 237 mm |
| Gewicht | 690 g |
| Themenwelt | Mathematik / Informatik ► Mathematik ► Wahrscheinlichkeit / Kombinatorik |
| ISBN-10 | 0-471-22618-1 / 0471226181 |
| ISBN-13 | 978-0-471-22618-5 / 9780471226185 |
| Zustand | Neuware |
| Haben Sie eine Frage zum Produkt? |
aus dem Bereich


