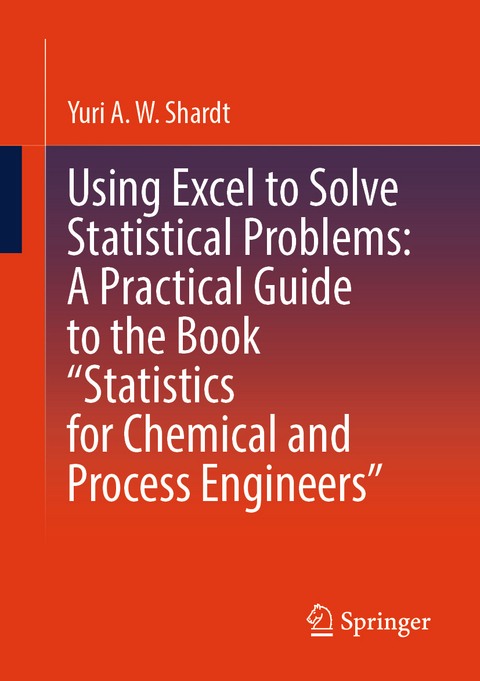
Using Excel to Solve Statistical Problems: A Practical Guide to the Book “Statistics for Chemical and Process Engineers”
Springer International Publishing (Verlag)
978-3-031-65448-0 (ISBN)
This book provides a complete overview of how to use Excel to solve typical statistical problems in engineering. In addition to short sections on the required theory, the focus of the book is on detailed Excel examples for solving specific problems. Furthermore, solutions are provided for standard problems that can then be re-used and modified as necessary. End-of-chapter questions allow the reader to independently test the knowledge acquired.
Professor Yuri A. W. Shardt is currently the chair of the Department of Automation Engineering in the Faculty of Computer Science and Automation at the Technical University of Ilmenau, working in the fields of big data, including process identification and monitoring with an emphasis on the development and industrial implementation of soft sensors; holistic control, including the development of advanced control strategies for complex industrial process; and the smart world, including implementations such as smart factories, smart home, Industry 4.0, and smart grids. Previously, he worked at the University of Waterloo in the Department of Chemical Engineering and at the University of Duisburg-Essen in the Institute of Control and Complex Systems as an Alexander von Humboldt Fellow. He has written over 60 papers appearing in such journals as "Automatica", "Journal of Process Control", "IEEE Transactions on Industrial Electronics", and "Industrial and Engineering Chemistry Research" on topics ranging from system identification, soft sensor development, to process control. He has presented his research at numerous conferences and taught various courses in the intersection between statistics, chemical engineering, process control, Excel®, and MATLAB®. In addition to his academic work, he has spent considerable time in industry working on implementing various process control solutions.
Introduction to Excel.- Data Visualisation.- Theoretical Statistics Distributions Hypothesis Testing and Confidence Intervals.- Regression Analysis and Design of Experiments.
| Erscheinungsdatum | 03.09.2024 |
|---|---|
| Zusatzinfo | XIV, 73 p. 51 illus., 40 illus. in color. |
| Verlagsort | Cham |
| Sprache | englisch |
| Maße | 148 x 210 mm |
| Themenwelt | Mathematik / Informatik ► Mathematik ► Angewandte Mathematik |
| Mathematik / Informatik ► Mathematik ► Statistik | |
| Technik | |
| Schlagworte | Data Visualisation using Excel • Detailed Examples of Using Excel for Statistical Problems • Regression Analysis with Excel • Solving Statistical Problems with Excel • Statistical Distributions in Excel |
| ISBN-10 | 3-031-65448-X / 303165448X |
| ISBN-13 | 978-3-031-65448-0 / 9783031654480 |
| Zustand | Neuware |
| Informationen gemäß Produktsicherheitsverordnung (GPSR) | |
| Haben Sie eine Frage zum Produkt? |
aus dem Bereich


