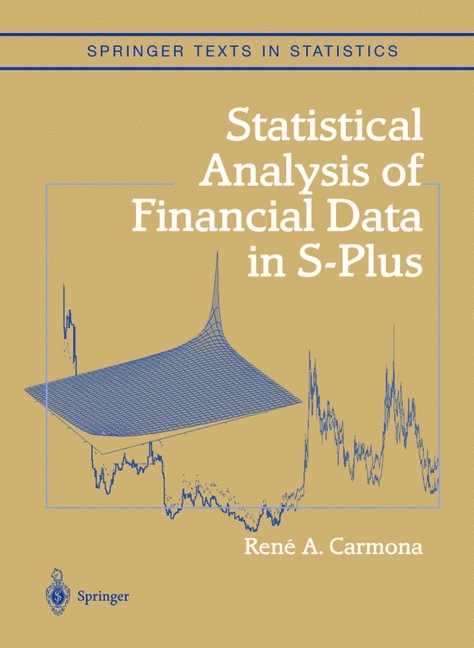
Statistical Analysis of Financial Data in S-plus
Springer-Verlag New York Inc.
978-0-387-20286-0 (ISBN)
- Titel erscheint in neuer Auflage
- Artikel merken
This is the first book at the graduate textbook level to discuss analyzing financial data with S-PLUS. Its originality lies in the introduction of tools for the estimation and simulation of heavy tail distributions and copulas, the computation of measures of risk, and the principal component analysis of yield curves. The book is aimed at undergraduate students in financial engineering; master students in finance and MBA's, and to practitioners with financial data analysis concerns.
Contents Part I Data Exploration, Estimation And Simulation 1 Univariate Exploratory Data Analysis 1.1 Data, Random Variables and Their Distributions 1.1.1 The PCS Data 1.1.2 The S&P 500 Index and Financial Returns 1.1.3 Random Variables and Their Distributions 1.1.4 Examples of Probability Distribution Families 1.2 First Exploratory Data Analysis Tools 1.2.1 Random Samples 1.2.2 Histograms 1.3 More Nonparametric Density Estimation 1.3.1 Kernel Density Estimation 1.3.2 Comparison with the Histogram 1.3.3 S&P Daily Returns 1.3.4 Importance of the Choice of the Bandwidth 1.4 Quantiles and Q-Q Plots 1.4.1 Understanding the Meaning of Q-Q Plots 1.4.2 Value at Risk and Expected Shortfall 1.5 Estimation from Empirical Data 1.5.1 The Empirical Distribution Function 1.5.2 Order Statistics 1.5.3 Empirical Q-Q Plots 1.6 Random Generators and Monte Carlo Samples 1.7 Extremes and Heavy Tail Distributions 1.7.1 S&P Daily Returns, Once More 1.7.2 The Example of the PCS Index 1.7.3 The Example of the Weekly S&P Returns Problems Notes & Complements 2 Multivariate Data Exploration 2.1 Multivariate Data and First Measure of Dependence 2.1.1 Density Estimation 2.1.2 The Correlation Coefficient 2.2 The Multivariate Normal Distribution 2.2.1 Simulation of Random Samples 2.2.2 The Bivariate Case 2.2.3 A Simulation Example 2.2.4 Let's Have Some Coffee 2.2.5 Is the Joint Distribution Normal? 2.3 Marginals and More Measures of Dependence 2.3.1 Estimation of the Coffee Log-Return Distributions 2.3.2 More Measures of Dependence 2.4 Copulas and Random Simulations 2.4.1 Copulas 2.4.2 First Examples of Copula Families 2.4.3 Copulas and General Bivariate Distributions 2.4.4 Fitting Copulas 2.4.5 Monte Carlo Simulations with Copulas 2.4.6 A Risk Management Example 2.5 Principal Component Analysis 2.5.1 Identification of the Principal Components of a Data Set 2.5.2 PCA with S-Plus 2.5.3 Effective Dimension of the Space of Yield Curves 2.5.4 Swap Rate Curves Appendix 1: Calculus with Random Vectors and Matrices Appendix 2: Families of Copulas Problems Notes & Complements Part II Regression 3 Parametric Regression 3.1 Simple Linear Regression 3.1.1 Getting the Data 3.1.2 First Plots 3.1.3 Regression Set-up 3.1.4 Simple Linear Regression 3.1.5 Cost Minimizations 3.1.6 Regression as a Minimization Problem 3.2 Regression for Prediction & Sensitivities 3.2.1 Prediction 3.2.2 Introductory Discussion of Sensitivity and Robustness 3.2.3 Comparing L2 and L1 Regressions 3.2.4 Taking Another Look at the Coffee Data 3.3 Smoothing versus Distribution Theory 3.3.1 Regression and Conditional Expectation 3.3.2 Maximum Likelihood Approach 3.4 Multiple Regression 3.4.1 Notation 3.4.2 The S-Plus Function lm 3.4.3 R2 as a Regression Diagnostic 3.5 Matrix Formulation and Linear Models 3.5.1 Linear Models 3.5.2 Least Squares (Linear) Regression Revisited 3.5.3 First Extensions 3.5.4 Testing the CAPM 3.6 Polynomial Regression 3.6.1 Polynomial Regression as a Linear Model 3.6.2 Example of S-Plus Commands 3.6.3 Important Remark 3.6.4 Prediction with Polynomial Regression 3.6.5 Choice of the Degree p 3.7 Nonlinear Regression 3.8 Term Structure of Interest Rates: A Crash Course 3.9 Parametric Yield Curve Estimation 3.9.1 Estimation Procedures 3.9.2 Practical Implementation 3.9.3 S-Plus Experiments 3.9.4 Concluding Remarks Appendix: Cautionary Notes on Some S-Plus Idiosyncracies Problems Notes & Complements 4 Local & Nonparametric Regression 4.1 Review of the Regression Setup 4.2 Natural Splines as Local Smoothers 4.3 Nonparametric Scatterplot Smoothers 4.3.1 Smoothing Splines 4.3.2 Locally Weighted Regression 4.3.3 A Robust Smoother 4.3.4 The Super Smoother 4.3.5 The Kernel Smoother 4.4 More Yield Curve Estimation 4.4.1 A First Estimation Method 4.4.2 A Direct Application of Smoothing Splines 4.4.3 US and Japanese Instantaneous Forward Rates 4.5 Multivariate Kernel Regression 4.5.1 Running the Kernel in S-Plus 4.5.2 An Example Involving the June 1998 S&P Futures Contract 193 4.6 Projection Pursuit Regression 4.6.1 The S-Plus Function ppreg 4.6.2 ppreg Prediction of the S&P Indicators 4.7 Nonparametric Option Pricing 4.7.1 Generalities on Option Pricing 4.7.2 Nonparametric Pricing Alternatives 4.7.3 Description of the Data 4.7.4 The Actual Experiment 4.7.5 Numerical Results Appendix: Kernel Density Estimation & Kernel Regression Problems Notes & Complements Part III Time Series & State Space Models 5 Time Series Models: Ar, Ma, Arma, & All That 5.1 Notation and First Definitions 5.1.1 Notation 5.1.2 Regular Time Series and Signals 5.1.3 Calendar and Irregular Time Series 5.1.4 Example of Daily S&P 500 Futures Contracts 5.2 High Frequency Data 5.2.1 TimeDate Manipulations 5.3 Time Dependent Statistics and Stationarity 5.3.1 Statistical Moments 5.3.2 The Notion of Stationarity 5.3.3 The Search for Stationarity 5.3.4 The Example of the CO2 Concentrations 5.4 First Examples of Models 5.4.1 White Noise 5.4.2 Random Walk 5.4.3 Auto Regressive Time Series 5.4.4 Moving Average Time Series 5.4.5 Using the Backward Shift Operator B 5.4.6 Linear Processes 5.4.7 Causality, Stationarity and Invertibility 5.4.8 ARMA Time Series 5.4.9 ARIMA Models 5.5 Fitting Models to Data 5.5.1 Practical Steps 5.5.2 S-Plus Implementation 5.6 Putting a Price on Temperature 5.6.1 Generalities on Degree Days 5.6.2 Temperature Options 5.6.3 Statistical Analysis of Temperature Historical Data Appendix: More S-Plus Idiosyncracies Problems Notes & Complements 6 Multivariate Time Series, Linear Systems & Kalman Filtering 6.1 Multivariate Time Series 6.1.1 Stationarity and Auto-Covariance Functions 6.1.2 Multivariate White Noise 6.1.3 Multivariate AR Models 6.1.4 Back to Temperature Options 6.1.5 Multivariate MA & ARIMA Models 6.1.6 Cointegration 6.2 State Space Models 6.3 Factor Models as Hidden Markov Processes 6.4 Kalman Filtering of Linear Systems 6.4.1 One-Step-Ahead Prediction 6.4.2 Derivation of the Recursive Filtering Equations 6.4.3 Writing an S Function for Kalman Prediction 6.4.4 Filtering 6.4.5 More Predictions 6.4.6 Estimation of the Parameters 6.5 Applications to Linear Models 6.5.1 State Space Representation of Linear Models 6.5.2 Linear Models with Time Varying Coefficients 6.5.3 CAPM with Time Varying a's 6.6 State Space Representation of Time Series 6.6.1 The Case of AR Series 6.6.2 The General Case of ARMA Series 6.6.3 Fitting ARMA Models by Maximum Likelihood 6.7 Example: Prediction of Quarterly Earnings Problems Notes & Complements 7 Nonlinear Time Series: Models and Simulation 7.1 First Nonlinear Time Series Models 7.1.1 Fractional Time Series 7.1.2 Nonlinear Auto-Regressive Series 7.1.3 Statistical Estimation 7.2 More Nonlinear Models: ARCH, GARCH & All That 7.2.1 Motivation 7.2.2 ARCH Models 7.2.3 GARCH Models 7.2.4 S-Plus Commands 7.2.5 Fitting a GARCH Model to Real Data 7.2.6 Generalizations 7.3 Stochastic Volatility Models 7.4 Discretization of Stochastic Differential Equations 7.4.1 Discretization Schemes 7.4.2 Monte Carlo Simulations: A First Example 7.5 Random Simulation and Scenario Generation 7.5.1 A Simple Model for the S&P 500 Index 7.5.2 Modeling the Short Interest Rate 7.5.3 Modeling the Spread 7.5.4 Putting Everything Together 7.6 Filtering of Nonlinear Systems 7.6.1 Hidden Markov Models 7.6.2 General Filtering Approach 7.6.3 Particle Filter Approximations 7.6.4 Filtering in Finance? Statistical Issues 7.6.5 Application: Tracking Volatility Appendix: Preparing Index Data Problems Notes & Complements Appendix: An Introduction To S And S-plus References Notation Index Data Set Index S-Plus Index Author Index Subject Index
| Erscheint lt. Verlag | 6.4.2004 |
|---|---|
| Reihe/Serie | Springer Texts in Statistics |
| Zusatzinfo | 138 black & white illustrations, biography |
| Verlagsort | New York, NY |
| Sprache | englisch |
| Maße | 178 x 254 mm |
| Gewicht | 1031 g |
| Themenwelt | Mathematik / Informatik ► Mathematik ► Computerprogramme / Computeralgebra |
| Mathematik / Informatik ► Mathematik ► Statistik | |
| Wirtschaft ► Allgemeines / Lexika | |
| Wirtschaft ► Betriebswirtschaft / Management ► Finanzierung | |
| ISBN-10 | 0-387-20286-2 / 0387202862 |
| ISBN-13 | 978-0-387-20286-0 / 9780387202860 |
| Zustand | Neuware |
| Informationen gemäß Produktsicherheitsverordnung (GPSR) | |
| Haben Sie eine Frage zum Produkt? |
aus dem Bereich


