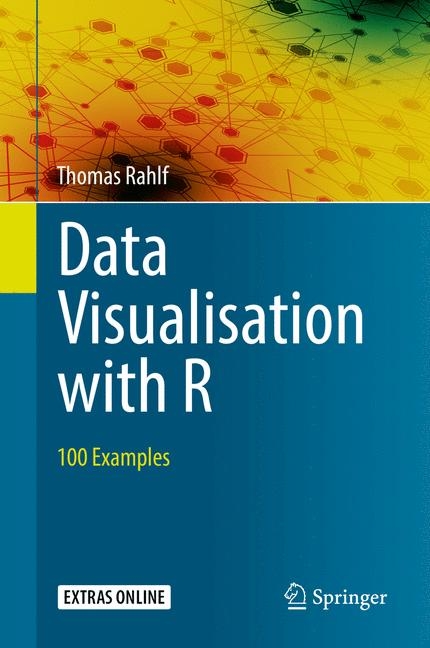
Data Visualisation with R
Springer International Publishing (Verlag)
978-3-319-49750-1 (ISBN)
- Titel erscheint in neuer Auflage
- Artikel merken
Thomas Rahlf has 20 years of experience in data visualization. Holding a PhD in the history of statistics and econometrics, his areas of expertise include also historical statistics, time series analysis and statistical inference. He is director in the department of quality and program management at the German Research Foundation as well as a lecturer at the University of Bonn, Germany. Graphics and statistics have been a key element of his work for a long time. Recent publications include "Statistical Inference" in the Handbook of Cliometrics (Springer Reference Series, 2016) and "The German Time Series Dataset, 1834-2012" (Journal of Economics and Statistics, Vol. 236/1). He is also the editor of a book about historical statistics of Germany.
Data for Everybody.- Structure and Technical Requirements.- Implementation in R.- Beyond R.- Regarding the Examples.- Categorical Data.- Distributions.- Time Series.- Scatter Plots.- Maps.- Illustrative Examples.
| Erscheinungsdatum | 17.02.2017 |
|---|---|
| Zusatzinfo | XV, 385 p. 181 illus., 162 illus. in color. |
| Verlagsort | Cham |
| Sprache | englisch |
| Maße | 155 x 235 mm |
| Themenwelt | Mathematik / Informatik ► Informatik ► Software Entwicklung |
| Schlagworte | Computer Applications • Computer Graphics • Computer Science • data visualisation • graphics programming • Information technology: general issues • probability and statistics • Professional Computing • R(Language) • statistical software • Statistics, general • Visualisation Toolkits • visualization application domains |
| ISBN-10 | 3-319-49750-2 / 3319497502 |
| ISBN-13 | 978-3-319-49750-1 / 9783319497501 |
| Zustand | Neuware |
| Haben Sie eine Frage zum Produkt? |
aus dem Bereich


