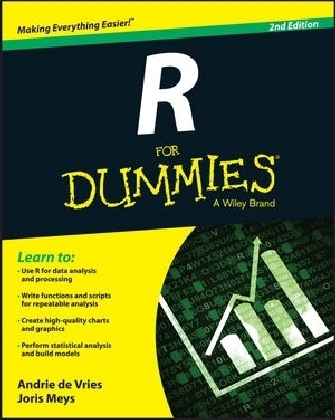
R For Dummies
For Dummies (Verlag)
978-1-119-05580-8 (ISBN)
- Titel ist leider vergriffen;
keine Neuauflage - Artikel merken
Mastering R has never been easier Picking up R can be tough, even for seasoned statisticians and data analysts. R For Dummies, 2nd Edition provides a quick and painless way to master all the R you'll ever need. Requiring no prior programming experience and packed with tons of practical examples, step-by-step exercises, and sample code, this friendly and accessible guide shows you how to know your way around lists, data frames, and other R data structures, while learning to interact with other programs, such as Microsoft Excel. You'll learn how to reshape and manipulate data, merge data sets, split and combine data, perform calculations on vectors and arrays, and so much more.
R is an open source statistical environment and programming language that has become very popular in varied fields for the management and analysis of data. R provides a wide array of statistical and graphical techniques, and has become the standard among statisticians for software development and data analysis. R For Dummies, 2nd Edition takes the intimidation out of working with R and arms you with the knowledge and know-how to master the programming language of choice among statisticians and data analysts worldwide.
Covers downloading, installing, and configuring R
Includes tips for getting data in and out of R
Offers advice on fitting regression models and ANOVA
Provides helpful hints for working with graphics
R For Dummies, 2nd Edition is an ideal introduction to R for complete beginners, as well as an excellent technical reference for experienced R programmers.
Andrie de Vries is a leading R expert and Business Services Director for Revolution Analytics. With over 20 years of experience, he provides consulting and training services in the use of R. Joris Meys is a statistician, R programmer and R lecturer with the faculty of Bio-Engineering at the University of Ghent.
Introduction 1
About This Book 1
Changes in the Second Edition 2
Conventions Used in This Book 3
What You’re Not to Read 4
Foolish Assumptions 4
How This Book Is Organized 5
Part I: Getting Started with R Programming 5
Part II: Getting Down to Work in R 5
Part III: Coding in R 5
Part IV: Making the Data Talk 5
Part V: Working with Graphics 6
Part VI: The Part of Tens 6
Icons Used in This Book 6
Beyond the Book 7
Where to Go from Here 7
Part I: Getting Started with R Programming 9
Chapter 1: Introducing R: The Big Picture 11
Recognizing the Benefits of Using R 12
It comes as free, open‐source code 12
It runs anywhere 13
It supports extensions 13
It provides an engaged community 13
It connects with other languages 14
Looking At Some of the Unique Features of R 15
Performing multiple calculations with vectors 15
Processing more than just statistics 16
Running code without a compiler 16
Chapter 2: Exploring R 19
Working with a Code Editor 20
Exploring RGui 21
Dressing up with RStudio 23
Starting Your First R Session 25
Saying hello to the world 25
Doing simple math 26
Using vectors 26
Storing and calculating values 27
Talking back to the user 28
Sourcing a Script 29
Echoing your work 30
Navigating the Environment 32
Manipulating the content of the environment 32
Saving your work 33
Retrieving your work 34
Chapter 3: The Fundamentals of R 35
Using the Full Power of Functions 35
Vectorizing your functions 36
Putting the argument in a function 37
Making history 39
Keeping Your Code Readable 40
Following naming conventions 40
Structuring your code 43
Adding comments 45
Getting from Base R to More 45
Finding packages 45
Installing packages 46
Loading and unloading packages 46
Part II: Getting Down to Work in R 49
Chapter 4: Getting Started with Arithmetic 51
Working with Numbers, Infinity, and Missing Values 51
Doing basic arithmetic 52
Using mathematical functions 54
Calculating whole vectors 57
To infinity and beyond 58
Organizing Data in Vectors 60
Discovering the properties of vectors 61
Creating vectors 63
Combining vectors 64
Repeating vectors 64
Getting Values in and out of Vectors 65
Understanding indexing in R 65
Extracting values from a vector 66
Changing values in a vector 67
Working with Logical Vectors 68
Comparing values 69
Using logical vectors as indices 70
Combining logical statements 71
Summarizing logical vectors 72
Powering Up Your Math 73
Using arithmetic vector operations 73
Recycling arguments 76
Chapter 5: Getting Started with Reading and Writing 79
Using Character Vectors for Text Data 79
Assigning a value to a character vector 80
Creating a character vector with more than one element 80
Extracting a subset of a vector 81
Naming the values in your vectors 82
Manipulating Text 84
String theory: Combining and splitting strings 84
Sorting text 88
Finding text inside text 89
Substituting text 91
Revving up with regular expressions 92
Factoring in Factors 94
Creating a factor 95
Converting a factor 96
Looking at levels 98
Distinguishing data types 99
Working with ordered factors 100
Chapter 6: Going on a Date with R 103
Working with Dates 104
Presenting Dates in Different Formats 106
Adding Time Information to Dates 107
Formatting Dates and Times 109
Performing Operations on Dates and Times 109
Addition and subtraction 109
Comparison of dates 110
Extraction 111
Chapter 7: Working in More Dimensions 113
Adding a Second Dimension 113
Discovering a new dimension 114
Combining vectors into a matrix 117
Using the Indices 118
Extracting values from a matrix 118
Replacing values in a matrix 120
Naming Matrix Rows and Columns 121
Changing the row and column names 122
Using names as indices 123
Calculating with Matrices 123
Using standard operations with matrices 124
Calculating row and column summaries 125
Doing matrix arithmetic 126
Adding More Dimensions 127
Creating an array 128
Using dimensions to extract values 129
Combining Different Types of Values in a Data Frame 130
Creating a data frame from a matrix 130
Creating a data frame from scratch 132
Naming variables and observations 133
Manipulating Values in a Data Frame 134
Extracting variables, observations, and values 135
Adding observations to a data frame 136
Adding variables to a data frame 139
Combining Different Objects in a List 140
Creating a list 141
Extracting components from lists 142
Changing the components in lists 144
Reading the output of str( ) for lists 146
Seeing the forest through the trees 148
Part III: Coding in R 149
Chapter 8: Putting the Fun in Functions 151
Moving from Scripts to Functions 151
Making the script 152
Transforming the script 153
Using the function 154
Reducing the number of lines 155
Using Arguments the Smart Way 157
Adding more arguments 157
Conjuring tricks with dots 159
Using functions as arguments 161
Coping with Scoping 163
Crossing the borders 164
Dispatching to a Method 165
Finding the methods behind the function 166
Doing it yourself 168
Chapter 9: Controlling the Logical Flow 171
Making Choices with if Statements 172
Doing Something Else with an if else Statement 174
Vectorizing Choices 176
Looking at the problem 176
Choosing based on a logical vector 176
Making Multiple Choices 178
Chaining if else statements 178
Switching between possibilities 180
Looping Through Values 181
Constructing a for loop 181
Calculating values in a for loop 182
Looping without Loops: Meeting the Apply Family 184
Looking at the family features 185
Meeting three of the members 185
Applying functions on rows and columns 186
Applying functions to listlike objects 188
Chapter 10: Debugging Your Code 193
Knowing What to Look For 193
Reading Errors and Warnings 194
Reading error messages 194
Caring about warnings (or not) 195
Going Bug Hunting 197
Calculating the logit 197
Knowing where an error comes from 197
Looking inside a function 198
Generating Your Own Messages 202
Creating errors 203
Creating warnings 203
Recognizing the Mistakes You’re Sure to Make 204
Starting with the wrong data 204
Having your data in the wrong format 205
Chapter 11: Getting Help 209
Finding Information in the R Help Files 209
When you know exactly what you’re looking for 210
When you don’t know exactly what you’re looking for 211
Searching the Web for Help with R 212
Getting Involved in the R Community 213
Discussing R on Stack Overflow and Stack Exchange 213
Using the R mailing lists 214
Tweeting about R 215
Making a Minimal Reproducible Example 215
Creating sample data with random values 215
Producing minimal code 217
Providing the necessary information 217
Part IV: Making the Data Talk 219
Chapter 12: Getting Data into and out of R 221
Getting Data into R 221
Entering data in the R text editor 222
Using the Clipboard to copy and paste 223
Reading data in CSV files 225
Reading data from Excel 229
Working with other data types 230
Getting Your Data out of R 232
Working with Files and Folders 233
Understanding the working directory 233
Manipulating files 234
Chapter 13: Manipulating and Processing Data 239
Deciding on the Most Appropriate Data Structure 239
Creating Subsets of Your Data 241
Understanding the three subset operators 241
Understanding the five ways of specifying the subset 242
Subsetting data frames 242
Adding Calculated Fields to Data 247
Doing arithmetic on columns of a data frame 247
Using with and transform to improve code readability 248
Creating subgroups or bins of data 249
Combining and Merging Data Sets 251
Creating sample data to illustrate merging 252
Using the merge( ) function 253
Working with lookup tables 255
Sorting and Ordering Data 257
Sorting vectors 257
Sorting data frames 258
Traversing Your Data with the Apply Functions 260
Using the apply( ) function to summarize arrays 261
Using lapply( ) and sapply( ) to traverse a list or data frame 263
Using tapply( ) to create tabular summaries 264
Getting to Know the Formula Interface 266
Whipping Your Data into Shape 268
Understanding data in long and wide formats 269
Getting started with the reshape2 package 270
Melting data to long format 270
Casting data to wide format 271
Chapter 14: Summarizing Data 275
Starting with the Right Data 275
Using factors or numeric data 276
Counting unique values 277
Preparing the data 277
Describing Continuous Variables 278
Talking about the center of your data 278
Describing the variation 279
Checking the quantiles 279
Describing Categories 281
Counting appearances 281
Calculating proportions 282
Finding the center 282
Describing Distributions 283
Plotting histograms 283
Using frequencies or densities 285
Describing Multiple Variables 287
Summarizing a complete dataset 287
Plotting quantiles for subgroups 288
Tracking correlations 290
Working with Tables 293
Creating a two‐way table 294
Converting tables to a data frame 295
Looking at margins and proportions 296
Chapter 15: Testing Differences and Relations 299
Taking a Closer Look at Distributions 300
Observing beavers 300
Testing normality graphically 301
Using quantile plots 302
Testing normality in a formal way 304
Comparing Two Samples 305
Testing differences 305
Comparing paired data 308
Testing Counts and Proportions 309
Checking out proportions 309
Analyzing tables 310
Extracting test results 312
Working with Models 313
Analyzing variances 313
Evaluating the differences 315
Modeling linear relations 318
Evaluating linear models 320
Predicting new values 323
Part V: Working with Graphics 325
Chapter 16: Using Base Graphics 327
Creating Different Types of Plots 327
Getting an overview of plot 328
Adding points and lines to a plot 329
Different plot types 332
Controlling Plot Options and Arguments 334
Adding titles and axis labels 335
Changing plot options 335
Putting multiple plots on a single page 339
Saving Graphics to Image Files 340
Chapter 17: Creating Faceted Graphics with Lattice 343
Creating a Lattice Plot 344
Loading the lattice package 345
Making a lattice scatterplot 345
Adding trend lines 346
Changing Plot Options 348
Adding titles and labels 348
Changing the font size of titles and labels 349
Using themes to modify plot options 350
Plotting Different Types 351
Making a bar chart 352
Making a box‐and‐whisker plot 353
Plotting Data in Groups 354
Using data in tall format 354
Creating a chart with groups 356
Adding a key 356
Printing and Saving a Lattice Plot 357
Assigning a lattice plot to an object 358
Printing a lattice plot in a script 358
Saving a lattice plot to file 358
Chapter 18: Looking At ggplot 2 Graphics 361
Installing and Loading ggplot2 361
Looking At Layers 362
Using Geoms and Stats 363
Defining what data to use 364
Mapping data to plot aesthetics 364
Getting geoms 365
Sussing Stats 369
Adding Facets, Scales, and Options 371
Adding facets 371
Changing options 372
Getting More Information 374
Part VI: The Part of Tens 375
Chapter 19: Ten Things You Can Do in R That You Would’ve Done in Microsoft Excel 377
Adding Row and Column Totals 377
Formatting Numbers 378
Sorting Data 380
Making Choices with If 380
Calculating Conditional Totals 381
Transposing Columns or Rows 382
Finding Unique or Duplicated Values 383
Working with Lookup Tables 383
Working with Pivot Tables 384
Using the Goal Seek and Solver 385
Chapter 20: Ten Tips on Working with Packages 387
Poking Around the Nooks and Crannies of CRAN 387
Finding Interesting Packages 388
Installing Packages 389
Loading Packages 389
Reading the Package Manual and Vignette 390
Updating Packages 390
Forging Ahead with R‐Forge 391
Getting packages from github 392
Conducting Installations from BioConductor 392
Reading the R Manual 393
Appendix A: Installing R and RStudio 395
Installing and Configuring R 395
Installing R 395
Configuring R 396
Installing and Configuring RStudio 398
Installing RStudio 398
Configuring RStudio 398
Appendix B: The r fordummies Package 401
Using rfordummies 401
Index 403
| Erscheint lt. Verlag | 21.7.2015 |
|---|---|
| Sprache | englisch |
| Maße | 188 x 231 mm |
| Gewicht | 567 g |
| Themenwelt | Mathematik / Informatik ► Informatik ► Programmiersprachen / -werkzeuge |
| Mathematik / Informatik ► Mathematik ► Computerprogramme / Computeralgebra | |
| ISBN-10 | 1-119-05580-6 / 1119055806 |
| ISBN-13 | 978-1-119-05580-8 / 9781119055808 |
| Zustand | Neuware |
| Informationen gemäß Produktsicherheitsverordnung (GPSR) | |
| Haben Sie eine Frage zum Produkt? |
aus dem Bereich


