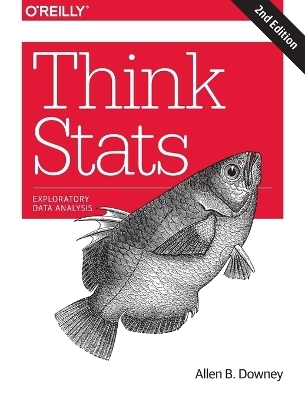
Think Stats
O'Reilly Media (Verlag)
978-1-4919-0733-7 (ISBN)
If you know how to program, you have the skills to turn data into knowledge, using tools of probability and statistics. This concise introduction shows you how to perform statistical analysis computationally, rather than mathematically, with programs written in Python.
By working with a single case study throughout this thoroughly revised book, you’ll learn the entire process of exploratory data analysis—from collecting data and generating statistics to identifying patterns and testing hypotheses. You’ll explore distributions, rules of probability, visualization, and many other tools and concepts.
New chapters on regression, time series analysis, survival analysis, and analytic methods will enrich your discoveries.
- Develop an understanding of probability and statistics by writing and testing code
- Run experiments to test statistical behavior, such as generating samples from several distributions
- Use simulations to understand concepts that are hard to grasp mathematically
- Import data from most sources with Python, rather than rely on data that’s cleaned and formatted for statistics tools
- Use statistical inference to answer questions about real-world data
Allen Downey is an Associate Professor of Computer Science at the Olin College of Engineering. He has taught computer science at Wellesley College, Colby College and U.C. Berkeley. He has a Ph.D. in Computer Science from U.C. Berkeley and Master's and Bachelor's degrees from MIT.
Chapter 1Exploratory Data Analysis
A Statistical Approach
The National Survey of Family Growth
Importing the Data
DataFrames
Variables
Transformation
Validation
Interpretation
Exercises
Glossary
Chapter 2Distributions
Representing Histograms
Plotting Histograms
NSFG Variables
Outliers
First Babies
Summarizing Distributions
Variance
Effect Size
Reporting Results
Exercises
Glossary
Chapter 3Probability Mass Functions
Pmfs
Plotting PMFs
Other Visualizations
The Class Size Paradox
DataFrame Indexing
Exercises
Glossary
Chapter 4Cumulative Distribution Functions
The Limits of PMFs
Percentiles
CDFs
Representing CDFs
Comparing CDFs
Percentile-Based Statistics
Random Numbers
Comparing Percentile Ranks
Exercises
Glossary
Chapter 5Modeling Distributions
The Exponential Distribution
The Normal Distribution
Normal Probability Plot
The lognormal Distribution
The Pareto Distribution
Generating Random Numbers
Why Model?
Exercises
Glossary
Chapter 6Probability Density Functions
PDFs
Kernel Density Estimation
The Distribution Framework
Hist Implementation
Pmf Implementation
Cdf Implementation
Moments
Skewness
Exercises
Glossary
Chapter 7Relationships Between Variables
Scatter Plots
Characterizing Relationships
Correlation
Covariance
Pearson’s Correlation
Nonlinear Relationships
Spearman’s Rank Correlation
Correlation and Causation
Exercises
Glossary
Chapter 8Estimation
The Estimation Game
Guess the Variance
Sampling Distributions
Sampling Bias
Exponential Distributions
Exercises
Glossary
Chapter 9Hypothesis Testing
Classical Hypothesis Testing
HypothesisTest
Testing a Difference in Means
Other Test Statistics
Testing a Correlation
Testing Proportions
Chi-Squared Tests
First Babies Again
Errors
Power
Replication
Exercises
Glossary
Chapter 10Linear Least Squares
Least Squares Fit
Implementation
Residuals
Estimation
Goodness of Fit
Testing a Linear Model
Weighted Resampling
Exercises
Glossary
Chapter 11Regression
StatsModels
Multiple Regression
Nonlinear Relationships
Data Mining
Prediction
Logistic Regression
Estimating Parameters
Implementation
Accuracy
Exercises
Glossary
Chapter 12Time Series Analysis
Importing and Cleaning
Plotting
Linear Regression
Moving Averages
Missing Values
Serial Correlation
Autocorrelation
Prediction
Further Reading
Exercises
Glossary
Chapter 13Survival Analysis
Survival Curves
Hazard Function
Estimating Survival Curves
Kaplan-Meier Estimation
The Marriage Curve
Estimating the Survival Function
Confidence Intervals
Cohort Effects
Extrapolation
Expected Remaining Lifetime
Exercises
Glossary
Chapter 14Analytic Methods
Normal Distributions
Sampling Distributions
Representing Normal Distributions
Central Limit Theorem
Testing the CLT
Applying the CLT
Correlation Test
Chi-Squared Test
Discussion
Exercises
| Erscheint lt. Verlag | 1.12.2014 |
|---|---|
| Zusatzinfo | black & white illustrations |
| Verlagsort | Sebastopol |
| Sprache | englisch |
| Maße | 187 x 233 mm |
| Gewicht | 384 g |
| Einbandart | Paperback |
| Themenwelt | Informatik ► Datenbanken ► Data Warehouse / Data Mining |
| Mathematik / Informatik ► Mathematik ► Statistik | |
| Mathematik / Informatik ► Mathematik ► Wahrscheinlichkeit / Kombinatorik | |
| Schlagworte | Angewandte Statistik • Datenanalyse und mathematische Statistik • Datenanlyse • Python (Programmiersprache) • Wahrscheinlichkeit |
| ISBN-10 | 1-4919-0733-9 / 1491907339 |
| ISBN-13 | 978-1-4919-0733-7 / 9781491907337 |
| Zustand | Neuware |
| Haben Sie eine Frage zum Produkt? |
aus dem Bereich


