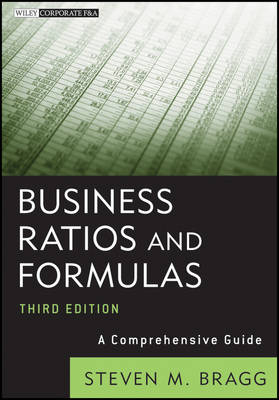
Business Ratios and Formulas
John Wiley & Sons Inc (Verlag)
978-1-118-16996-4 (ISBN)
A complete appraisal of analytical tools available to managers to assess performance Required reading for anyone starting, running, or growing a business, Business Ratios and Formulas, Third Edition puts answers at the fingertips of business managers, with nearly 250 operational criteria and clear, easy-to-understand explanations that can be used right away. The Third Edition includes twenty new measurements.
Approximately 20 new measurements
Offers a comprehensive resource of nearly 250 operational criteria
An Appendix including a dictionary of accounting and finance terms
A thorough list of every ratio and formula, and how to compile and interpret that information
Also by Steven M. Bragg: Fast Close: A Guide to Closing the Books Quickly, Second Edition
An ideal tool for measuring corporate performance, this authoritative resource allows you to pick and choose the tools you need to best assess your organization's performance.
STEVEN M. BRAGG, CPA, has been the chief financial officer or controller of four companies, as well as a consulting manager at Ernst & Young and auditor at Deloitte. He is the author of over thirty books primarily targeted toward corporate financial leaders (controllers, treasurers, and CFOs) and their needs. Bragg received a master's degree in finance from Bentley College, an MBA from Babson College, and a bachelor's degree in economics from the University of Maine.
Preface xv
Acknowledgments xvii
Chapter 1: Introduction 1
Chapter 2: Asset Utilization Measurements 5
Sales to Working Capital Ratio 6
Sales to Fixed Assets Ratio 7
Sales to Administrative Expenses Ratio 8
Sales to Equity Ratio 9
Sales per Person 10
Sales Backlog Ratio 12
Sales Returns to Gross Sales Ratio 13
Repairs and Maintenance Expense to Fixed Assets Ratio 14
Accumulated Depreciation to Fixed Assets Ratio 15
Capital to Labor Ratio 17
Fringe Benefits to Wages and Salaries Expense 18
Sales Expenses to Sales Ratio 19
Discretionary Cost Ratio 19
Interest Expense to Debt Ratio 20
Foreign Exchange Ratios 21
Overhead Rate 22
Goodwill to Assets Ratio 25
Overhead to Cost of Sales Ratio 26
Investment Turnover 27
Break-Even Point 28
Margin of Safety 29
Tax Rate Percentage 30
Chapter 3: Operating Performance Measurements 31
Operating Assets Ratio 31
Sales to Operating Income Ratio 33
Sales Margin 34
Gross Profit Percentage 34
Gross Profit Index 35
Investment Income Percentage 36
Operating Profit Percentage 38
Operating Leverage Ratio 39
Net Income Percentage 40
Core Operating Earnings 41
Profit per Customer Visit 42
Profit per Person 43
Core Growth Rate 44
Quality of Earnings Ratio 45
Chapter 4: Cash Flow Measurements 47
Cash Flow from Operations 47
Free Cash Flow 49
Cash Flow Return on Sales 50
Fixed Charge Coverage 51
Expense Coverage Days 52
Cash Flow Coverage Ratio 54
Cash Receipts to Billed Sales and Progress Payments 55
Cash to Current Assets Ratio 55
Cash Flow to Fixed Asset Requirements 56
Cash Flow Return on Assets 58
Cash to Working Capital Ratio 59
Cash Reinvestment Ratio 60
Cash to Current Liabilities Ratio 61
Cash Flow to Debt Ratio 62
Reinvestment Rate 63
Stock Price to Cash Flow Ratio 64
Dividend Payout Ratio 65
Chapter 5: Liquidity Measurements 67
Accounts Receivable Turnover 68
Average Receivable Collection Period 69
Days Delinquent Sales Outstanding 70
Days Sales in Receivables Index 71
Accounts Receivable Investment 72
Ending Receivable Balance 73
Inventory to Sales Ratio 74
Inventory Turnover 75
Inventory to Working Capital Ratio 77
Liquidity Index 78
Accounts Payable Days 79
Accounts Payable Turnover 80
Current Ratio 81
Quick Ratio 82
Cash Ratio 83
Sales to Current Assets Ratio 84
Working Capital Productivity 85
Days of Working Capital 86
Weighted Working Capital 87
Defensive Interval Ratio 88
Current Liability Ratio 89
Required Current Liabilities to Total Current Liabilities Ratio 90
Working Capital to Debt Ratio 91
Risky Asset Conversion Ratio 92
Noncurrent Assets to Noncurrent Liabilities Ratio 93
Short-Term Debt to Long-Term Debt Ratio 94
Altman’s Z-Score Bankruptcy Prediction Formula 95
Chapter 6: Capital Structure and Solvency Measurements 99
Times Interest Earned 99
Cash Coverage Ratio 100
Debt Coverage Ratio 101
Asset Quality Index 102
Accruals to Assets Ratio 104
Times Preferred Dividend Earned 105
Debt to Equity Ratio 107
Funded Capital Ratio 108
Retained Earnings to Stockholders’ Equity 109
Preferred Stock to Total Stockholders’ Equity 110
Issued Shares to Authorized Shares 111
Chapter 7: Return on Investment Measurements 113
Net Worth 113
Book Value per Share 115
Tangible Book Value 116
Return on Assets Employed 117
Return on Infrastructure Employed 119
Return on Operating Assets 120
Return on Equity Percentage 121
Return on Common Equity 122
Financial Leverage Index 123
Equity Growth Rate 124
Earnings per Share 125
Percentage Change in Earnings per Share 126
Economic Value Added 127
EVA Momentum 129
Relative Value of Growth 130
Dividend Payout Ratio 131
Dividend Yield Ratio 133
Chapter 8: Market Performance Measurements 135
Insider Stock Buy-Sell Ratio 135
Institutional Capture Rate 137
Market Value Added 138
Enterprise Value/Earnings Ratio 139
Stock Options to Common Shares Ratio 140
Cost of Capital 142
Sales to Stock Price Ratio 144
Price/Earnings Ratio 145
Capitalization Rate 146
Chapter 9: Measurements for the Accounting/Finance Department 147
Purchase Discounts Taken to Total Discounts 148
Percentage of Payment Discounts Missed 149
Transactions Processed per Person 150
Transaction Error Rate 151
Average Time to Issue Invoices 152
Average Employee Expense Report Turnaround Time 154
Payroll Transaction Fees per Employee 155
Time to Produce Financial Statements 157
Percentage of Tax Filing Dates Missed 158
Proportion of Products Costed Prior to Release 159
Internal Audit Savings to Cost Percentage 160
Internal Audit Efficiency 161
Deduction Turnover 162
Bad Debt Percentage 163
Percent of Receivables over XX Days Old 164
Allowance Exhaustion Rate 165
Percentage Collected of Dollar Volume Assigned 166
Cash Collected per Aging Bucket 167
Collection Effectiveness Index 168
Best Possible DSO 169
Partial Payment Agreement Percentage 170
Percent of Cash Applied on Day of Receipt 171
Auto Cash Hit Rate 172
Unmatched Receipts Exposure 172
Cost of Credit 173
Earnings Rate on Invested Funds 174
Brokerage Fee Percentage 175
Borrowing Base Usage Percentage 176
Chapter 10: Measurements for the Engineering Department 179
Bill of Materials Accuracy 179
Labor Routing Accuracy 181
Idea Kill Rate 182
Percentage of New Products Introduced 183
Percentage of Sales from New Products 184
Percentage of New Parts Used in New Products 185
Percentage of Existing Parts Reused in New Products 186
Average Number of Distinct Products per Design Platform 187
Percentage of Products Reaching Market before Competition 188
Return on Innovation Investment 189
Intangibility Index 189
Science Linkage Index 190
Ratio of Actual to Target Cost 191
Warranty Claims Percentage 192
Time from Design Inception to Production 193
Percentage of Floor Space Utilization 194
Chapter 11: Measurements for the Human Resources Department 197
Employee Turnover 197
Average Time to Hire 198
Late Personnel Requisitions Ratio 199
Sendouts per Hire 200
Intern Hiring Percentage 201
Ratio of Support Staff to Total Staff 201
Employment Cost Effectiveness 202
Chapter 12: Measurements for the Logistics Department 205
Production Schedule Accuracy 206
Economic Order Quantity 207
Number of Orders to Place in a Period 208
Economic Production Run Size 209
Raw Material Inventory Turns 209
Raw Material Content 210
Finished Goods Inventory Turns 211
Obsolete Inventory Percentage 212
Percentage of Inventory > XX Days Old 213
Percentage of Returnable Inventory 214
Excess Inventory Index 215
Inventory Accuracy 216
Percentage of Certified Suppliers 217
Electronic Data Interchange Supplier Percentage 218
Distribution Turnover 219
Supplier Fill Rate 220
On-Time Parts Delivery Percentage 221
Purchased Component Defect Rate 223
Incoming Components Correct Quantity Percentage 224
Percentage of Actual Payments Varying from Purchase Order Price 225
Percentage of Purchase Orders Issued below Minimum Dollar Level 226
Proportion of Corporate Credit Card Usage 227
Percentage of Receipts Authorized by Purchase Orders 228
Freight Audit Recovery Ratio 230
Picking Accuracy for Assembled Products 231
Order Fill Rate 231
Average Time to Ship 232
On-Time Delivery Percentage 234
Dock-to-dock Time 234
Percentage of Products Damaged in Transit 236
Percentage of Sales through Distributors 237
Chapter 13: Measurements for the Production Department 239
Constraint Productivity 240
Takt Time 240
Constraint Rework Percentage 241
Constraint Schedule Attainment 242
Constraint Utilization 243
Operational Equipment Effectiveness 244
Degree of Unbalance 245
Throughput Effectiveness 246
Manufacturing Critical Path Time 248
Manufacturing Efficiency 249
Break-Even Plant Capacity 250
Manufacturing Effectiveness 251
Productivity Index 252
Unit Output per Direct Labor Hour 253
Average Equipment Setup Time 255
Unscheduled Machine Downtime Percentage 255
Mean Time between Failures 257
Acceptable Product Completion Percentage 258
Work-in-Process Turnover 259
Work-in-Process to Standard Work-in-Process 260
Scrap Percentage 261
First-Time-Through Yield 262
Warranty Claims Percentage 263
Maintenance Expense to Fixed Assets Ratio 264
Indirect Expense Index 265
Reorder Point 266
On-Time Delivery Ratio 268
Chapter 14: Measurements for the Sales and Marketing Department 271
Market Share 271
Customer Turnover 272
Advertising Value Equivalency 273
Net Promoter Score 274
Browse-to-Buy Conversion Ratio 275
Recency 276
Direct Mail Effectiveness Ratio 277
Inbound Telemarketing Retention Ratio 279
Proportion of Completed Sales to Home Page Views 280
Quote to Close Ratio 281
Pull-Through Rate 282
Sales per Salesperson 283
Sales Productivity 284
Sales Effectiveness 285
Sales Trend Percentage by Product Line 286
Product Demand Elasticity 287
Days of Backlog 288
Chapter 15: Measurement Analysis with an Electronic Spreadsheet 291
Financial Statement Proportional Analysis 292
Financial Statement Ratio Analysis 294
Automated Ratio Result Analysis 296
Leverage Analysis 297
Trend Analysis 298
Forecasting 299
Cash Flow Analysis 303
Capital Asset Analysis 305
Compounding Analysis 307
Investment Analysis 309
Risk Analysis 311
Appendix: Measurement Summary 313
Glossary 339
About the Author 345
Index 347
| Erscheint lt. Verlag | 13.4.2012 |
|---|---|
| Reihe/Serie | Wiley Corporate F&A |
| Verlagsort | New York |
| Sprache | englisch |
| Maße | 188 x 262 mm |
| Gewicht | 762 g |
| Themenwelt | Mathematik / Informatik ► Mathematik ► Finanz- / Wirtschaftsmathematik |
| Wirtschaft ► Betriebswirtschaft / Management ► Rechnungswesen / Bilanzen | |
| ISBN-10 | 1-118-16996-4 / 1118169964 |
| ISBN-13 | 978-1-118-16996-4 / 9781118169964 |
| Zustand | Neuware |
| Haben Sie eine Frage zum Produkt? |
aus dem Bereich


