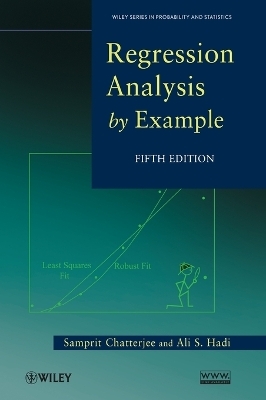
Regression Analysis by Example
John Wiley & Sons Inc (Verlag)
978-0-470-90584-5 (ISBN)
- Titel erscheint in neuer Auflage
- Artikel merken
Praise for the Fourth Edition:
"This book is . . . an excellent source of examples for regression analysis. It has been and still is readily readable and understandable."
—Journal of the American Statistical Association Regression analysis is a conceptually simple method for investigating relationships among variables. Carrying out a successful application of regression analysis, however, requires a balance of theoretical results, empirical rules, and subjective judgment. Regression Analysis by Example, Fifth Edition has been expanded and thoroughly updated to reflect recent advances in the field. The emphasis continues to be on exploratory data analysis rather than statistical theory. The book offers in-depth treatment of regression diagnostics, transformation, multicollinearity, logistic regression, and robust regression.
The book now includes a new chapter on the detection and correction of multicollinearity, while also showcasing the use of the discussed methods on newly added data sets from the fields of engineering, medicine, and business. The Fifth Edition also explores additional topics, including:
Surrogate ridge regression
Fitting nonlinear models
Errors in variables
ANOVA for designed experiments
Methods of regression analysis are clearly demonstrated, and examples containing the types of irregularities commonly encountered in the real world are provided. Each example isolates one or two techniques and features detailed discussions, the required assumptions, and the evaluated success of each technique. Additionally, methods described throughout the book can be carried out with most of the currently available statistical software packages, such as the software package R.
Regression Analysis by Example, Fifth Edition is suitable for anyone with an understanding of elementary statistics.
SAMPRIT CHATTERJEE, PhD, is Professor Emeritus of Statistics at New York University. A Fellow of the American Statistical Association, Dr. Chatterjee has been a Fulbright scholar in both Kazhakstan and Mongolia. He is the coauthor of Sensitivity Analysis in Linear Regression and A Casebook for a First Course in Statistics and Data Analysis, both published by Wiley. ALI S. HADI, PhD, is a Distinguished University Professor and former vice provost at the American University in Cairo (AUC). He is the founding Director of the Actuarial Science Program at AUC. He is also a Stephen H. Weiss Presidential Fellow and Professor Emeritus at Cornell University. Dr. Hadi is the author of four other books, a Fellow of the American Statistical Association, and an elected Member of the International Statistical Institute.
Preface xiv 1 Introduction 1
1.1 What Is Regression Analysis? 1
1.2 Publicly Available Data Sets 2
1.3 Selected Applications of Regression Analysis 3
1.4 Steps in Regression Analysis 13
1.5 Scope and Organization of the Book 21
Exercises 23
2 Simple Linear Regression 25
2.1 Introduction 25
2.2 Covariance and Correlation Coefficient 25
2.3 Example: Computer Repair Data 30
2.4 The Simple Linear Regression Model 32
2.5 Parameter Estimation 33
2.6 Tests of Hypotheses 36
2.7 Confidence Intervals 41
2.8 Predictions 41
2.9 Measuring the Quality of Fit 43
2.10 Regression Line Through the Origin 46
2.11 Trivial Regression Models 48
2.12 Bibliographic Notes 49
Exercises 49
3 Multiple Linear Regression 57
3.1 Introduction 57
3.2 Description of the Data and Model 57
3.3 Example: Supervisor Performance Data 58
3.4 Parameter Estimation 61
3.5 Interpretations of Regression Coefficients 62
3.6 Centering and Scaling 64
3.7 Properties of the Least Squares Estimators 67
3.8 Multiple Correlation Coefficient 68
3.9 Inference for Individual Regression Coefficients 69
3.10 Tests of Hypotheses in a Linear Model 71
3.11 Predictions 81
3.12 Summary 82
Exercises 82
Appendix: Multiple Regression in Matrix Notation 89
4 Regression Diagnostics: Detection of Model Violations 93
4.1 Introduction 93
4.2 The Standard Regression Assumptions 94
4.3 Various Types of Residuals 96
4.4 Graphical Methods 98
4.5 Graphs Before Fitting a Model 101
4.6 Graphs After Fitting a Model 105
4.7 Checking Linearity and Normality Assumptions 105
4.8 Leverage, Influence, and Outliers 106
4.9 Measures of Influence 111
4.10 The Potential-Residual Plot 115
4.11 What to Do with the Outliers? 116
4.12 Role of Variables in a Regression Equation 117
4.13 Effects of an Additional Predictor 122
4.14 Robust Regression 123
Exercises 123
5 Qualitative Variables as Predictors 129
5.1 Introduction 129
5.2 Salary Survey Data 130
5.3 Interaction Variables 133
5.4 Systems of Regression Equations 136
5.5 Other Applications of Indicator Variables 147
5.6 Seasonality 148
5.7 Stability of Regression Parameters Over Time 149
Exercises 151
6 Transformation of Variables 163
6.1 Introduction 163
6.2 Transformations to Achieve Linearity 165
6.3 Bacteria Deaths Due to XRay Radiation 167
6.4 Transformations to Stabilize Variance 171
6.5 Detection of Heteroscedastic Errors 176
6.6 Removal of Heteroscedasticity 178
6.7 Weighted Least Squares 179
6.8 Logarithmic Transformation of Data 180
6.9 Power Transformation 181
6.10 Summary 185
Exercises 186
7 Weighted Least Squares 191
7.1 Introduction 191
7.2 Heteroscedastic Models 192
7.3 Two-Stage Estimation 195
7.4 Education Expenditure Data 197
7.5 Fitting a Dose-Response Relationship Curve 206
Exercises 208
8 The Problem of Correlated Errors 209
8.1 Introduction: Autocorrelation 209
8.2 Consumer Expenditure and Money Stock 210
8.3 Durbin-Watson Statistic 212
8.4 Removal of Autocorrelation by Transformation 214
8.5 Iterative Estimation With Autocorrelated Errors 216
8.6 Autocorrelation and Missing Variables 217
8.7 Analysis of Housing Starts 218
8.8 Limitations of Durbin-Watson Statistic 222
8.9 Indicator Variables to Remove Seasonality 223
8.10 Regressing Two Time Series 226
Exercises 228
9 Analysis of Collinear Data 233
9.1 Introduction 233
9.2 Effects of Collinearity on Inference 234
9.3 Effects of Collinearity on Forecasting 240
9.4 Detection of Collinearity 245
Exercises 254
10 Working With Collinear Data 259
10.1 Introduction 259
10.2 Principal Components 259
10.3 Computations Using Principal Components 263
10.4 Imposing Constraints 263
10.5 Searching for Linear Functions of the β’s 267
10.6 Biased Estimation of Regression Coefficients 272
10.7 Principal Components Regression 272
10.8 Reduction of Collinearity in the Estimation Data 274
10.9 Constraints on the Regression Coefficients 276
10.10 Principal Components Regression: A Caution 277
10.11 Ridge Regression 280
10.12 Estimation by the Ridge Method 281
10.13 Ridge Regression: Some Remarks 285
10.14 Summary 287
10.15 Bibliographic Notes 288
Exercises 288
Appendix 10.A: Principal Components 291
Appendix 10.B: Ridge Regression 294
Appendix 10.C: Surrogate Ridge Regression 297
11 Variable Selection Procedures 299
11.1 Introduction 299
11.2 Formulation of the Problem 300
11.3 Consequences of Variables Deletion 300
11.4 Uses of Regression Equations 302
11.5 Criteria for Evaluating Equations 303
11.6 Collinearity and Variable Selection 306
11.7 Evaluating All Possible Equations 306
11.8 Variable Selection Procedures 307
11.9 General Remarks on Variable Selection Methods 309
11.10 A Study of Supervisor Performance 310
11.11 Variable Selection With Collinear Data 314
11.12 The Homicide Data 314
11.13 Variable Selection Using Ridge Regression 317
11.14 Selection of Variables in an Air Pollution Study 318
11.15 A Possible Strategy for Fitting Regression Models 326
11.16 Bibliographic Notes 327
Exercises 328
Appendix: Effects of Incorrect Model Specifications 332
12 Logistic Regression 335
12.1 Introduction 335
12.2 Modeling Qualitative Data 336
12.3 The Logit Model 336
12.4 Example: Estimating Probability of Bankruptcies 338
12.5 Logistic Regression Diagnostics 341
12.6 Determination of Variables to Retain 342
12.7 Judging the Fit of a Logistic Regression 345
12.8 The Multinomial Logit Model 347
12.8.1 Multinomial Logistic Regression 347
12.9 Classification Problem: Another Approach 354
Exercises 355
13 Further Topics 359
13.1 Introduction 359
13.2 Generalized Linear Model 359
13.3 Poisson Regression Model 360
13.4 Introduction of New Drugs 361
13.5 Robust Regression 363
13.6 Fitting a Quadratic Model 364
13.7 Distribution of PCB in U.S. Bays 366
Exercises 370
Appendix A: Statistical Tables 371
References 381
Index 389
| Erscheint lt. Verlag | 5.10.2012 |
|---|---|
| Reihe/Serie | Wiley Series in Probability and Statistics |
| Zusatzinfo | Tables: 70 B&W, 0 Color; Graphs: 105 B&W, 0 Color |
| Verlagsort | New York |
| Sprache | englisch |
| Maße | 183 x 259 mm |
| Gewicht | 907 g |
| Themenwelt | Mathematik / Informatik ► Mathematik ► Wahrscheinlichkeit / Kombinatorik |
| ISBN-10 | 0-470-90584-0 / 0470905840 |
| ISBN-13 | 978-0-470-90584-5 / 9780470905845 |
| Zustand | Neuware |
| Haben Sie eine Frage zum Produkt? |
aus dem Bereich


