Business Statistics Using Excel
Seiten
2010
Oxford University Press (Verlag)
978-0-19-955689-2 (ISBN)
Oxford University Press (Verlag)
978-0-19-955689-2 (ISBN)
- Titel ist leider vergriffen;
keine Neuauflage - Artikel merken
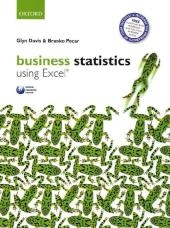
Business Statistics Using Excel is packed full of examples and integrated Excel screenshots, guiding students step-by-step through the theory and methods behind the use of statistics in the real world. Student exercises running throughout each chapter serve to engage students and encourage self-directed learning and testing.
Business Statistics Using Excel provides students with the tools they need to confidently approach their course, using screenshots to integrate Excel effectively throughout the text. Each chapter is packed with exercises to engage students and encourage self testing. The authors provide various pedagogical features to show how statistics are used in the real world, including numerous examples throughout, and running 'techniques in practice' exercises at the end of each chapter. The book also contains chapters on how to use Excel and a maths refresher, as well as hosting a numerical skills revision chapter online, all of which help to reinforce students' confidence in their mathematical ability, even if they feel they have forgotten what they have previously learnt. The text is based around a typical one semester business statistics course, thus ensuring that the content maps well to the modules. It is also accompanied by an extensive Online Resource Centre providing a wealth of self-test questions for students, and a test bank for lecturers.
Online Resource Centre Student resources: Numerical skills workbook Multiple-choice questions Annotated web links Online glossary of terms Revision tips Podcasts Lecturer resources: Instructor's manual (including detailed worked answers to the exercises in the book) Cases from the book with suggested solutions Assignment questions Examination questions PowerPoint slides for each chapter Test bank of questions (a suite of 15-20 questions per chapter, comprising and equal number of multiple choice, multiple response and true-false questions) The test bank can be downloaded by lecturers and imported into an appropriate e-Learning platform.
1. Introduction to Excel; 2. Numerical Skills Revision; 3. Visualising and Presenting Data; 4. Data Descriptors; 5. Probability Distributions; 6. Sampling Distributions and Estimating; 7. Introduction to Parametric Hypothesis Testing; 8. Chi-Squared and Non-Parametric test; 9. Factorial Experiments; 10. Linear Regression and Correlation; 11. Time Series Data and Analysis
| Erscheint lt. Verlag | 7.1.2010 |
|---|---|
| Zusatzinfo | 314 screenshots 205 figures |
| Verlagsort | Oxford |
| Sprache | englisch |
| Maße | 189 x 246 mm |
| Gewicht | 1369 g |
| Themenwelt | Informatik ► Office Programme ► Excel |
| Mathematik / Informatik ► Mathematik ► Finanz- / Wirtschaftsmathematik | |
| Mathematik / Informatik ► Mathematik ► Statistik | |
| Wirtschaft ► Allgemeines / Lexika | |
| ISBN-10 | 0-19-955689-X / 019955689X |
| ISBN-13 | 978-0-19-955689-2 / 9780199556892 |
| Zustand | Neuware |
| Haben Sie eine Frage zum Produkt? |
Mehr entdecken
aus dem Bereich
aus dem Bereich
raffinierte Zaubereien für Excel-Kenner
Buch | Softcover (2024)
Markt + Technik (Verlag)
24,95 €
Komplett in Farbe. Ideal für alle Einsteiger, Umsteiger und auch …
Buch | Softcover (2022)
Markt + Technik Verlag
12,95 €
Datenanalyse und Reporting mit Power Query, Power Pivot und Power BI …
Buch (2023)
Carl Hanser (Verlag)
44,99 €


