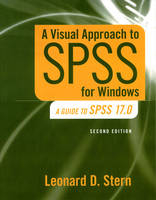
Visual Approach to SPSS for Windows, A
Pearson (Verlag)
978-0-205-70605-1 (ISBN)
- Titel erscheint in neuer Auflage
- Artikel merken
This book is great for anyone interested in learning to use SPSS!
Leonard Stern teaches courses in statistics, research methods, and human memory in the Department of Psychology at Eastern Washington Unversity. He received a B.A. in chemistry from Colby College, an M.A. from the University of Oregon in interdisciplinary studies, and an M. A. and Ph.D. in experimental psychology from the University of Oregon. He is the author of a text book on memory and one describing use of a software package to perform psychology experiments using computers. One of his current areas of interest is circumstances under which false memory occurs.
Preface
Chapter 1: The Basics
Chapter 2: Entering and Saving Data
Chapter 3: Modifying Data in the Data Editor
Chapter 4: Defining Variables' Properties
Chapter 5: The SPSS Statistics Viewer
Chapter 6: Graphing Data with the Chart Builder
Chapter 7: Data Transformation and Case Selection
Chapter 8: The Frequencies Procedure
Chapter 9: Other Procedures for Obtaining Descriptive Measures
Chapter 10: Bivariate Correlation and Regression
Chapter 11: Multiple Regression and Correlation
Chapter 12: Chi-Square Tests of Independence and Goodness-of-Fit
Chapter 13: One and Two Sample T-Tests
Chapter 14: One-Way Analysis of Variance
Chapter 15: Two-Way and Higher Order Analyses of Variance
Chapter 16: Within-Subjects ANOVAS
Chapter 17: Nonparametric or Distribution Free Tests
Chapter 18: Exploratory Factor Analysis
Chapter 19: Discriminant Analysis
Appendix A: Using the Chart Editor to Insert a Reference Line and Data Labels
Appendix B: Using the Chart Editor to Add a Title to the X-Axis
Appendix C: Using Codebook to Obtain an Overview of the Variables in a Data File
References
Index
| Sprache | englisch |
|---|---|
| Maße | 218 x 276 mm |
| Gewicht | 820 g |
| Themenwelt | Mathematik / Informatik ► Mathematik ► Computerprogramme / Computeralgebra |
| ISBN-10 | 0-205-70605-3 / 0205706053 |
| ISBN-13 | 978-0-205-70605-1 / 9780205706051 |
| Zustand | Neuware |
| Haben Sie eine Frage zum Produkt? |
aus dem Bereich


