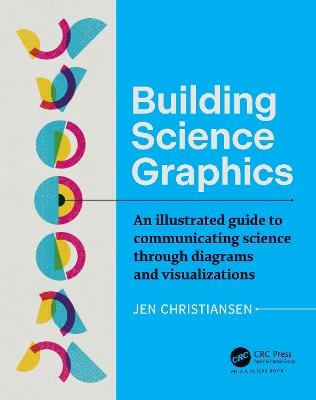
Building Science Graphics
Taylor & Francis Ltd (Verlag)
978-1-032-10940-4 (ISBN)
Building Science Graphics: An illustrated guide to communicating science through diagrams and visualizations is a practical guide for anyone—regardless of previous design experience and preferred drawing tools—interested in creating science-centric illustrated explanatory diagrams. Starting with a clear introduction to the concept of information graphics and their role in contemporary science communication, it then outlines a process for creating graphics using evidence-based design strategies. The heart of the book is composed of two step-by-step graphical worksheets, designed to help jump-start any new project. The author website, featuring further resources and links, can be found here: https://www.buildingsciencegraphics.com/. This is both a textbook and a practical reference for anyone that needs to convey scientific information in an illustrated form for articles, poster presentations, slide shows, press releases, blog posts, social media posts and beyond.
Jen Christiansen is a senior graphics editor at Scientific American, where she art directs and produces illustrated information graphics and data visualizations. She completed undergraduate studies in geology and art at Smith College, then happily merged the two disciplines in the scientific illustration graduate program at the University of California, Santa Cruz. She began her publishing career in New York at Scientific American in 1996, moved to Washington DC to join the art department of National Geographic, spent four years as a freelance science communicator, then returned to Scientific American in 2007. She writes and presents on topics ranging from reconciling her love for art and science, to her quest to learn more about the pulsar chart on Joy Division's Unknown Pleasures album cover.
Part 1. Underpinning. 1. Introduction. 2. What are Science Graphics. 3. Science Communication Fundamentals. 4. Graphic Design Fundamentals. 5. Perception Science. 6. Making Sense of Visual Complexity. 7. Organization and Emphasis. 8. Color. 9. Typography. 10. Visual Style. 11. Storytelling Strategies. 12. Practicalities. Part 2. Illustrating Science. 13. Special Considerations for Science Graphics. 14. Types of Science Graphics. Part 3. D.I.Y. (do it yourself). 15. The Process of Building Graphics. 16. Step-by-Step Guide for Building. 17. Step-by-Step Guide for Adapting. Part 4. Joint Efforts. 18. Collaborations.
| Erscheinungsdatum | 01.12.2022 |
|---|---|
| Reihe/Serie | AK Peters Visualization Series |
| Zusatzinfo | 1 Tables, color; 228 Line drawings, color; 27 Line drawings, black and white; 10 Halftones, color; 238 Illustrations, color; 27 Illustrations, black and white |
| Verlagsort | London |
| Sprache | englisch |
| Maße | 190 x 241 mm |
| Gewicht | 821 g |
| Themenwelt | Kunst / Musik / Theater ► Design / Innenarchitektur / Mode |
| Informatik ► Grafik / Design ► Film- / Video-Bearbeitung | |
| Mathematik / Informatik ► Informatik ► Theorie / Studium | |
| ISBN-10 | 1-032-10940-8 / 1032109408 |
| ISBN-13 | 978-1-032-10940-4 / 9781032109404 |
| Zustand | Neuware |
| Haben Sie eine Frage zum Produkt? |
aus dem Bereich


